USD/JPY posted sharp losses last week, as the pair fell 240 points. The pair closed just above the 104 line, its lowest weekly close since August 2014. This week has five events on the schedule. Here is an outlook on the major events moving the yen and an updated technical analysis for USD/JPY.
The yen surged last week, as the Bank of Japan refrained from any easing moves. In the US, the Fed held rates and gave no hints about a rate hike. Retail Sales were within expectations, while inflation levels remain low, as underscored by last week’s CPI reports.
do action=”autoupdate” tag=”USDJPYUpdate”/]
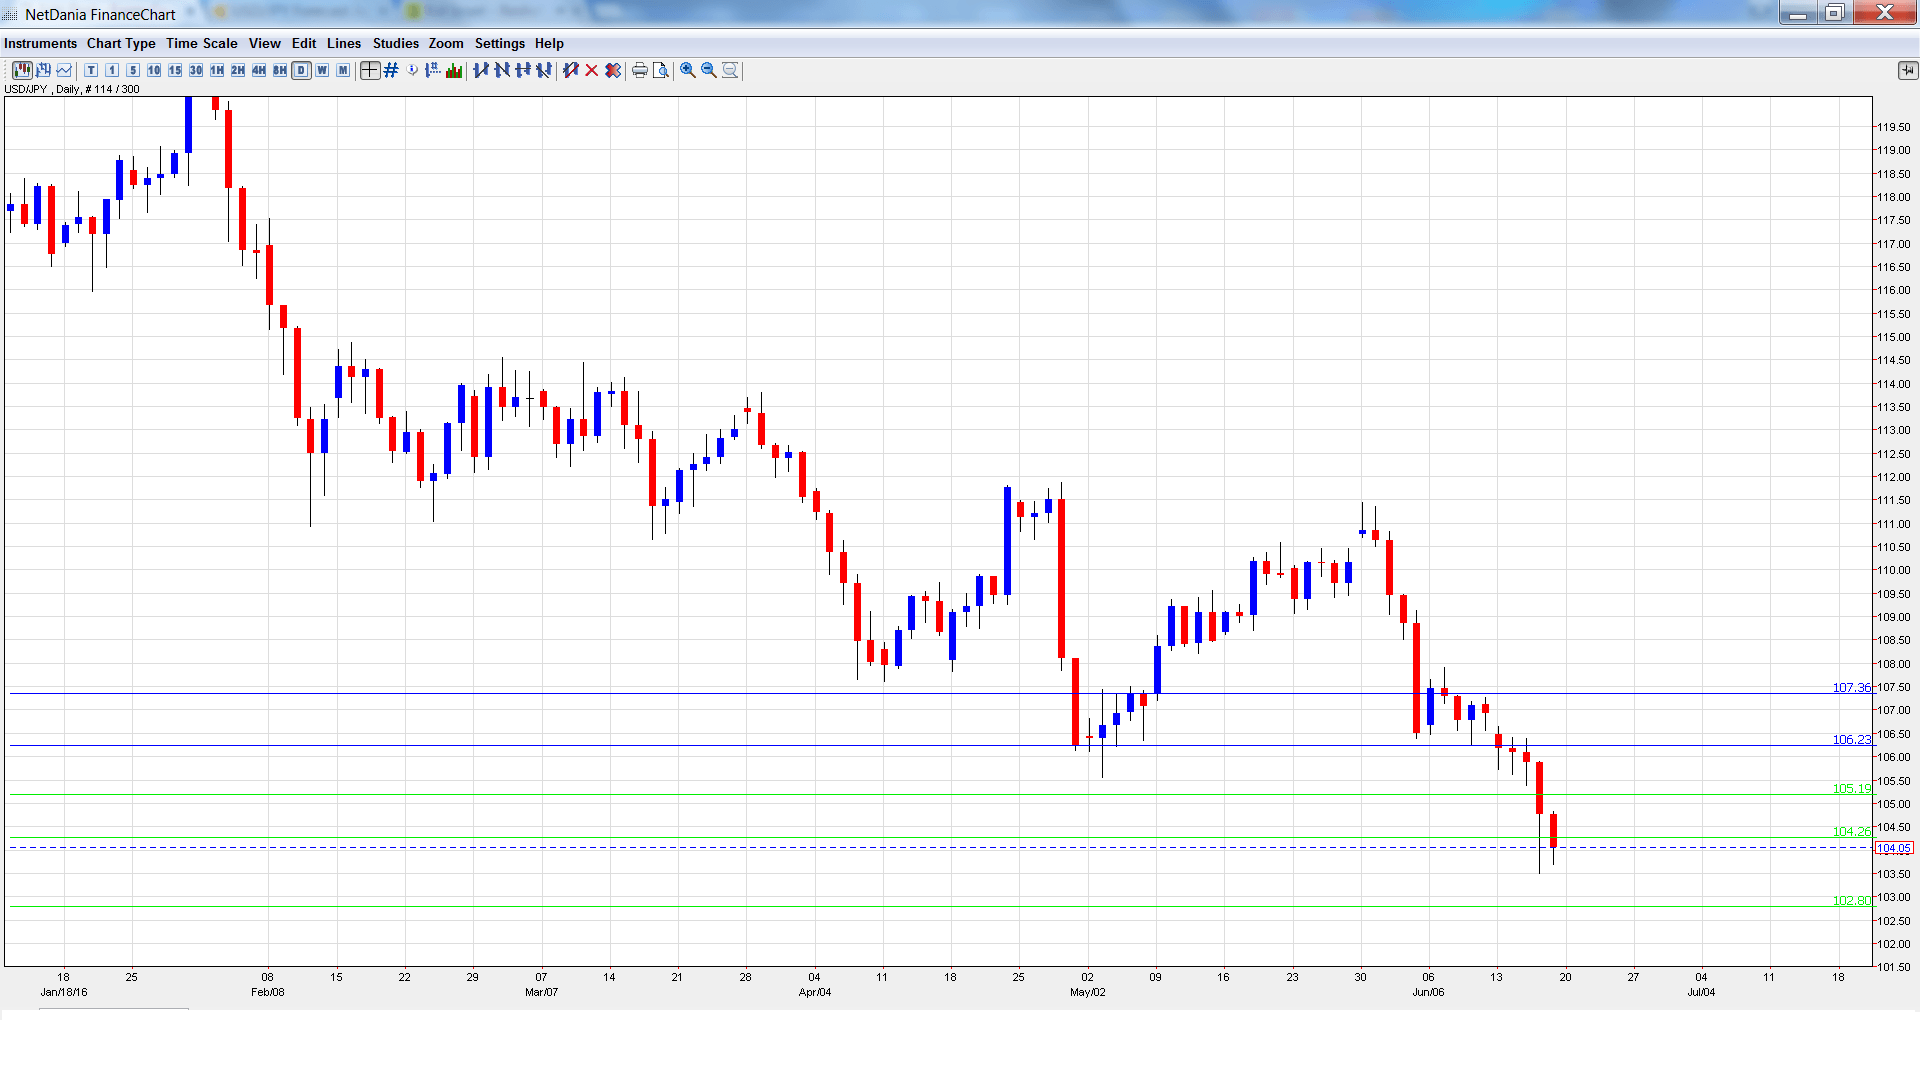
USD/JPY graph with support and resistance lines on it. Click to enlarge:
- Trade Balance: Sunday, 23:50. Trade Balance is closely linked to currency demand. The trade surplus has been steadily climbing and reached JPY 0.43 trillion in April, well above expectations. However, the surplus is expected to soften in May, with the estimate standing at JPY 0.13 trillion.
- Monetary Policy Meeting Minutes: Monday, 23:50. The minutes provide details of the BoJ’s policy meeting. Any hints about easing measures could weaken the yen.
- All Industries Activity: Tuesday, 4:30. The indicator posted a small gain of 0.1% in March, well short of the forecast of 0.7%. The markets are expecting a strong gain in April, with a forecast of 1.3%.
- Flash Manufacturing PMI: Thursday, 2:00. This PMI provides a snapshot of the health of the manufacturing sector. The index continues to post readings below the 50-level, pointing to ongoing contraction. The indicator is expected to improve slightly in June, with an estimate of 48.2 points.
- SPPI: Thursday, 23:50. This index measures inflation in the corporate sector. The indicator has been very steady, posting four consecutive gains of 0.2%. The estimate for May stands at 0.1%.
* All times are GMT
USD/JPY Technical Analysis
USD/JPY opened the week at 106.48 and touched a high of 106.64. The pair then reversed directions and dropped to a low of 103.50, breaking past support at 104.25 (discussed last week). USD/JPY closed the week at 104.05.
Live chart of USD/JPY: [do action=”tradingviews” pair=”USDJPY” interval=”60″/]
Technical lines from top to bottom:
With USD/JPY posting sharp losses, we start at lower levels:
107.39 is a strong resistance line.
106.25 was tested in resistance early in the week before the pair posted sharp losses.
105.19 was a cushion in October 2014.
104.25 is a weak resistance line. It could see further action early in the week.
102.80 is providing support.
101.51 was a cushion in August 2014.
100.54 is the final support level for now.
I am bearish on USD/JPY
With the BoJ showing no appetite for further easing, the yen could continue to move closer to the symbolic 100 level. The Fed also remained on the sidelines last week, and could refrain from a rate hike until September or even later.
Our latest podcast is titled Oil, Brexit and the Big Fed Preview
Follow us on Sticher or on iTunes
Further reading:
- For a broad view of all the week’s major events worldwide, read the USD outlook.
- For EUR/USD, check out the Euro to Dollar forecast.
- For the Japanese yen, read the USD/JPY forecast.
- For GBP/USD (cable), look into the British Pound forecast.
- For the Canadian dollar (loonie), check out the Canadian dollar forecast.
- For the kiwi, see the NZD/USD forecast
