USD/JPY dropped about 140 points last week, as USD/JPY closed just below the 120 line. This week’s highlights are Tokyo Core CPI and Retail Sales. Here is an outlook on the major events moving the yen and an updated technical analysis for USD/JPY.
The Japanese yen took advantage of broad US dollar weakness after the Federal Reserve statement last week. The Fed certainly sounded more dovish despite removing the “patience” guidance, raising doubts about a June rate hike.
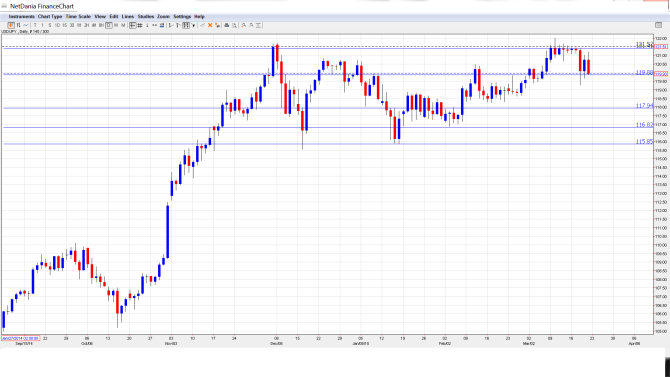
[do action=”autoupdate” tag=”USDJPYUpdate”/]USD/JPY graph with support and resistance lines on it:
- Flash Manufacturing PMI: Tuesday, 1:35. The minor index dipped to 51.5 points in February, well short of the estimate of 52.6 points. This followed three straight readings of 52.1 points. The estimate for the March report stands at 52.1 points.
- SPPI: Tuesday, 23:50. This index measures corporate inflation. The index dipped to 3.4%, within expectations. This followed after three consecutive readings of 3.6%. Little change is expected in the March report.
- Household Spending: Thursday, 23:30. This is an important indicator of consumer spending. The indicator continues to post sharp declines, and dropped to -5.1% in January, well off the forecast of -4.0%. Another decline is expected, with an estimate of -3.1%.
- Tokyo Core CPI: Thursday, 23:30. Tokyo Core CPI is the most important inflation indicator and should be treated as a market-mover. The index has posted two consecutive readings of 2.2%, and this is the estimate for the March report.
- Retail Sales: Thursday, 23:50. Retail Sales is the primary gauge of consumer spending, and can have a significant impact on the direction of USD/JPY. The indicator disappointed in January, coming in at -2.0%. This missed expectations and was the first decline since June. Another decline is anticipated in February, with the estimate standing at -1.4%.
* All times are GMT
USD/JPY Technical Analysis
USD/JPY started the week at 121.32. The pair climbed to a high of 121.52, testing resistance at 121.39 (discussed last week). The pair then reversed directions, dropping to a low of 119.29. USD/JPY closed the week at 119.93.
Live chart of USD/JPY: [do action=”tradingviews” pair=”USDJPY” interval=”60″/]
Technical lines from top to bottom:
124.16 marked the start of a yen rally in June 2007, which saw USD/JPY drop to the 96 level.
122.19 is the next resistance line.
121.39 was tested for a second straight week as the pair posted gains early in the week before retracting. It starts the week as a strong resistance line.
119.88 was tested as the pair dropped sharply. It is currently a weak support level, just below the pair’s close at 119.93. This line could see further activity early in the week. 117.94 is next.
116.82 is providing strong support and has remained intact since mid-January.
115.85 is the final support level for now.
I am bullish on USD/JPY
We could see the dollar bounce back after a poor showing last week. The US economy remains strong, and divergence in monetary policy will continue to weigh on the yen. If Japanese key data does not beat expectations, we could see the dollar push above the 120 level.
In our latest podcast we discuss The Fed and the road ahead – all you need to know
Subscribe to Market Movers on iTunes
Further reading:
- For a broad view of all the week’s major events worldwide, read the USD outlook.
- For EUR/USD, check out the Euro to Dollar forecast.
- For the Japanese yen, read the USD/JPY forecast.
- For GBP/USD (cable), look into the British Pound forecast.
- For the Australian dollar (Aussie), check out the AUD to USD forecast.
- For the kiwi, see the NZDUSD forecast.
