The Japanese yen reversed directions last week and dropped 180 points. USD/JPY closed at the 114 level. This week’s key events are Final GDP and BSI Manufacturing Index. Here is an outlook for the highlights of this week and an updated technical analysis for USD/JPY.
In the US, Donald Trump’s speech was short on substance and disappointed the markets. Still, expectations of a March rate hike boosted the greenback. Hawkish comments from Dudley and then from Brainard have sharply raised expectations of a March hike. In Japan, Household Spending was unexpectedly weak, and inflation indicators continue to post declines.
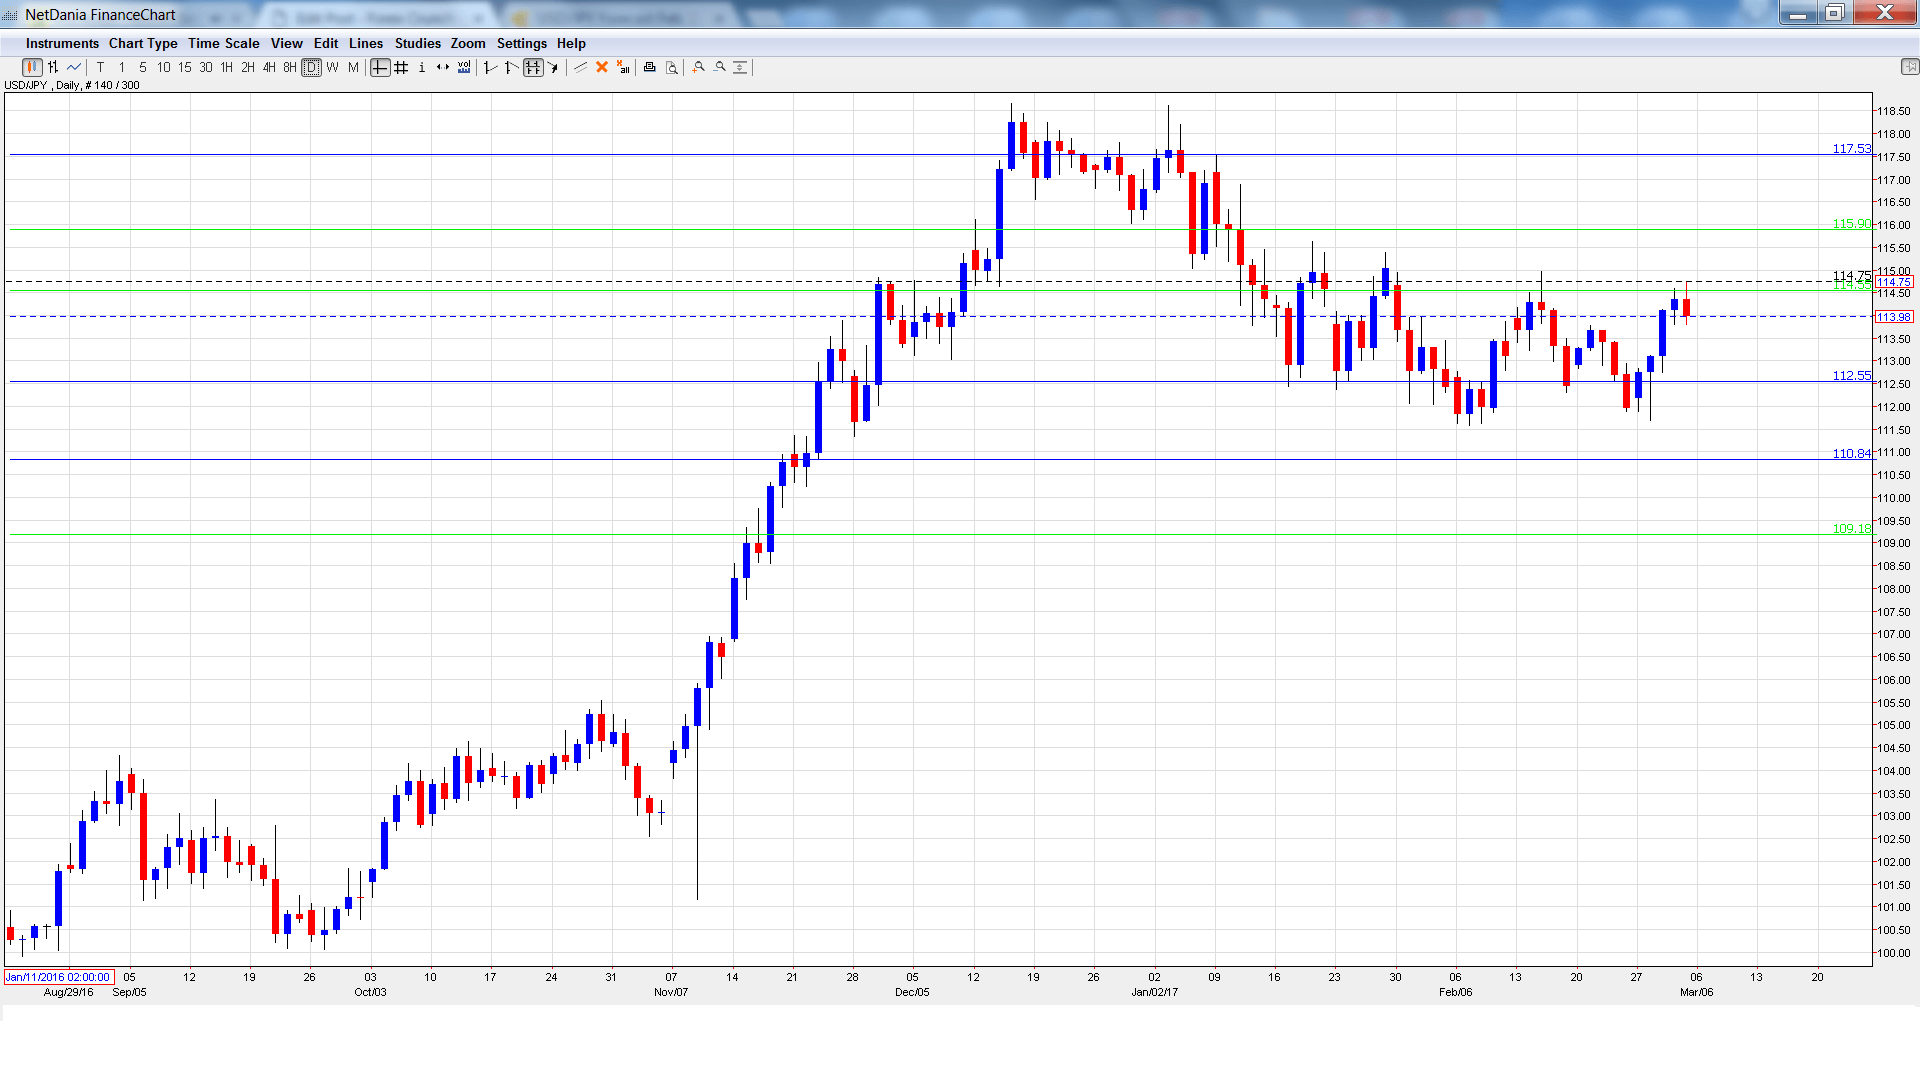
[do action=”autoupdate” tag=”USDJPYUpdate”/]USD/JPY graph with support and resistance lines on it. Click to enlarge:
- 30-y Bond Auction: Tuesday, 3:45. The yield on 30-year bonds has been rising steadily, reaching 0.91% in February. Will the upswing continue at the March auction?
- BoJ Core CPI: Tuesday, 5:00. The BOJ tracks consumer inflation based on this indicator, as it excludes the most volatile items which are included in CPI. The index edged down to 01% in the last release, matching the estimate.
- Final GDP: Tuesday, 23:50. GDP is a key event and should be treated as a market-mover. In Q3, the Preliminary GDP showed a gain of 0.2%. The revised GDP report is expected to improve to 0.4%.
- Economy Watchers Sentiment: Wednesday, 5:00. The indicator dipped to 49.8 in January, short of the forecast of 51.9 points. Little change is expected in the February report.
- M2 Money Stock: Wednesday, 23:50. The indicator showed improvement in the fourth quarter, and continued to improve in January, gaining 4.1%. This edged above the forecast of 4.0%. The upswing is expected to continue in February, with an estimate of 4.2%.
- Average Cash Earnings: Thursday, 00:00. This indicator measures worker income, which is correlated with consumer spending. The indicator continues to produce weak gains, and edged lower to 0.1% in December, missing the estimate of 0.4%. The markets are expecting better news in January, with a forecast of 0.3%.
- Preliminary Machine Tool Orders: Thursday, 6:00. After a long streak of declines, the indicator has posted two straight gains. In January, the indicator softened, with a gain of 3.5%.
- BSI Manufacturing Index: Thursday, 23:50. The manufacturing sector continues to improve and climbed to 7.5 in Q3, above the forecast or 3.4 points. The upswing is expected to continue in Q4, with the estimate standing at 8.4 points.
USD/JPY opened the week at 112.18 and dropped to a low of 111.69 early in the week. The pair then reversed directions and climbed to a high of 114.75, testing resistance at 114.55 (discussed last week). USD/JPY closed the week at 113.98.
Live chart of USD/JPY:
Technical lines from top to bottom:
With USD/JPY posting strong gains last week, we begin at higher levels:
117.52 was a high point in February 2016.
115.90 is next.
114.55 was an important cap in mid-2016.
112.53 was a cap in April 2016. It is a weak resistance line.
110.83 is next.
109.18 marked the start of a rally in September 2008 which saw USD/JPY drop close to the 0.87 level. It is the final support line for now.
I am bullish on USD/JPY
The Trump administration’s first month in office has been beset by difficulties, and there could be more trouble ahead from the combative and unpredictable Trump. Still the US economy is doing well and growing optimism over a March rate hike is bullish for the US dollar.
Our latest podcast is titled March hike, Macron, and Mario Draghi
Follow us on Sticher or iTunes
Safe trading!
Further reading:
- For a broad view of all the week’s major events worldwide, read the USD outlook.
- For EUR/USD, check out the Euro to Dollar forecast.
- For the Japanese yen, read the USD/JPY forecast.
- For GBP/USD (cable), look into the British Pound forecast.
- For the Canadian dollar (loonie), check out the Canadian dollar forecast.
- For the kiwi, see the NZD/USD forecast.
