After the big intervention that followed the big collapse, USD/JPY had an amazingly stable week. But now we have more figures to rock the pair. Tankan Manufacturing Index is the market mover this week. Here is an outlook on the major events ahead and an updated technical analysis for USD/JPY.
Exports rose 9.0% in February from a year earlier, exceeding a forecasts for a 8.6% increase. The trade balance came to a surplus of 654.1 billion yen ($8.1 billion), compared with the median forecast of 894.5 billion yen, after the first deficit in 22 months in January. Production in March is likely to be affected by the earthquake. On a seasonally adjusted basis, exports will decline almost on a similar magnitude. It may be difficult to restore the pre-quake level and it is assumed that recovery will happen in June.
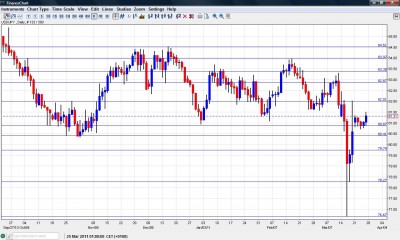
USD/JPY daily chart with support and resistance lines marked. Click to enlarge:
Let’s start:
-
Household Spending: Monday, 23:30. January household spending dropped 1.0% following a 3.3% decrease in December. Food, clothing and culture were the main causes for the decrease. However this is a smaller decline than the 1.4% drop forecasted. A small rise of 0.1% is predicted now.
-
Retail Sales: Monday, 23:50. Japanese retail sales unexpectedly rose 0.1% in January well above the 1.6% drop predicted. This rise indicates a slight improvement in the Japanese economy. A drop of 0.4% is expected.
-
Prelim Industrial Production: Tuesday, 23:50. Japan’s industrial production rose 2.4% in January following 3.3% gain in December. The rise was below economists predictions of 4.1% increase. Exports were weaker due to the impact of the Chinese Lunar New Year holiday that month. A flat rate is predicted now.
-
Manufacturing PMI: Wednesday, 23:15. Japan Manufacturing Purchasing Managers Index (PMI) rose to a seasonally adjusted 52.9 in February from 51.4 in January indicating expansion in the Japanese market. Exports grew while a surge in cost inflation badly impact manufacturers.
-
Average Cash Earnings: Thursday, 1:30. Salaries of Japanese employees grew 0.2% to Y272,719 in January posting the 11th straight y/y rise. This reading is below the 0.4% rise expected but more than the 0.1% in the previous month. Another rise of 0.3% is forecasted.
-
Housing Starts: Thursday, 5:00. Housing starts gained 2.7% in January while forecasted to be 5.1%. The Annualized housing starts showed an actual reading of 0.847 M houses compared to the previous reading of 0.861 M houses forecasted to be 0.873 M houses. As for the construction orders showed an actual reading of -10.7% compared to the previous reading of 13.1%. A climb of 7.7% is expected now.
-
Tankan Manufacturing Index: Thursday, 23:50. The Tankan Large Manufacturing Index fell 3 points along the fourth quarter reaching 5 while 3 points were expected. This increase indicates improving conditions in the market. Meantime the Tankan Non-Manufacturing Index also fell to 1 point in the Q4 2010, slightly better than 0 forecasted and following 2 points in the September quarter. According to the report, the decline on the index came as a result of a strong yen and slowing overseas growth. Tankan Large Manufacturing Index is expected to rise to 6 points while Tankan Non-Manufacturing Index is forecasted to reach 2 points.
*All times are GMT
USD/JPY Technical Analysis
Dollar/yen traded in a very narrow range, around 80.90 (discussed last week). Only at the end of the week, it moved slightly upwards and closed at 81.31, slightly above last week’s levels.
82 is the initial and very strong line. It capped the pair after the big international intervention and will give a good fight now as well. Above, we find another intervention related block – 82.87 – it was the point were the BOJ intervened back in September 2010 and will also be watched now.
Above, 83.40 provides more resistance, though weaker than earlier. Dollar/yen failed to reach this area before the earthquake. Further above, 84 provides more resistance after capping an attempt to rise a few weeks ago.
Even higher is 84.50 which is the highest level since October and is a very tough resistance line. The last line for now is 85.93, which was the top that the pair made after the BOJ intervention in September.
Looking down, 80.90, which just served as a pivotal line, works as the first support line. It’s followed by the November’s lows of 80.40, which also worked two weeks ago.
Lower the 1995 low of 79.75 line that also capped the pair just before the intervention and is still of high importance. Further below this historic line, in previously uncharted territory, 78.27 proved to be an important cushion for further falls. 76.25 is the last line, being the new all time low.
I continue being bullish on USD/JPY.
The severe damage from the earthquake, tsunami and nuclear disaster, finds an already weak Japanese economy. Together with the coordinated intervention and the hawkish Federal Reserve, there is lots of room for gains.
further reading:
- For a broad view of all the week’s major events worldwide, read the USD outlook.
- For EUR/USD, check out the Euro/Dollar forecast.
- For GBP/USD (cable), look into the British Pound forecast.
- For the Australian dollar (Aussie), check out the AUD to USD forecast.
- For the New Zealand dollar (kiwi), read the NZD forecast.
- For USD/CAD (loonie), check out the Canadian dollar.
