Dollar/yen managed to regain some of the losses towards the end of the Japanese fiscal year. Is this a change of course or a temporary adjustment? Tankan Manufacturing / non Manufacturing Index and Average Cash Earnings are the main events this week. Here’s an outlook for the Japanese events and an updated technical analysis for USD/JPY.
Last week encouraging readings were released concerning Japan’s economy with Retail sales beating expectations by jumping 3.5% in January, following a 2.5% climb in December, indicating Japanese economy is returning to pre-earthquake levels. More good news came with the yen’s decline aiding exporters and lifting consumer sentiment. Will this growth trend continue?
Updates: Housing Starts sparkled, as the indicator climbed 7%, a sixth-month high. Tankan Manufacturing Index was well below the market forecast, at -4. Tankan Non-Manufacturing Index dropped to -5. The Monetary Base release shocked the markets, dropping by 0.2%. The markets had called for a 12.6% increase. This was the worst reading since September 2008. Average Cash Earnings rose 0.7%, above the market forecast, and hitting a nine-month high. USD/JPY has fallen below the 82 level, trading at 81.90. The Leading Indicators Index rose to 95.6%, a sixth-month high.
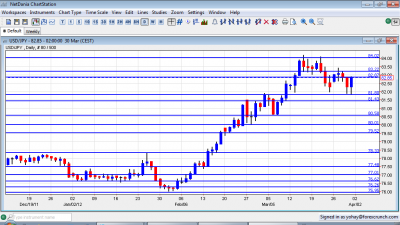
USD/JPY daily chart with support and resistance lines on it. Click to enlarge:
- Tankan Manufacturing Index: Sunday, 23:50. Business conditions in the manufacturing sector have worsened in the fourth quarter of 2011 due to a decline in foreign trade and the strong yen. The reading showed a 4 point decline from2 in the September quarter. In contrast, Tankan non-Manufacturing Index surprised with an improved sentiment gaining 4 points in the fourth quarter, well above the 1 point reading anticipated by analysts, following 1 point in the September quarter. Tankan Manufacturing Index is expected to be flat this time while the non -manufacturing index is predicted to increase to 5.
- Monetary Base: Monday, 23:50.Japan’s domestic cash in circulation increased by 11.3% in February from the previous year following 15.0% gain in January. This reading was lower than the 15.6% rise predicted by economists. A further increase of 12.6% is expected now.
- Average Cash Earnings: Tuesday, 1:30. Japanese net salaries remained unchanged in January from a year earlier except for overtime pay increasing for the fifth straight month by 1.2%. Improved market conditions are expected to lift Average cash earnings win the following months. A rise of 0.2% is anticipated.
- Leading Indicators: Friday, 5:00. The index of leading indicators, predicting market conditions for the coming months, contracted to 94.4 in January, revised from 94.9 after93.8 in the previous month amid a decline in consumer confidence and stock prices. An increase to 95.6 is predicted.
* All times are GMT
USD/JPY Technical Analysis
$/yen started the week battling the 82.87 line (mentioned last week). It then made a short-lived move higher, topping 84, before falling once again. After bottoming out at 81.80, it rose once again, closing just under the 82.87 line.
Technical lines from top to bottom
We remain oh high ground. 88.12 capped the pair back in July 2010, and also worked beforehand as support. It is followed by the round number of 87, which worked as support back then, and is minor resistance now.
86.27 was a distinct line of support and resistance in the summer of 2010 and is the next line if 85.50 is crossed. 85.50 is a key line. This was a peak after a strong move in March 2011. It held for more than one day.
84.50 capped the pair at the end of 2010 and at the beginning of 2011 and is a bit weaker now. An important line of resistance is found at 84, which capped the pair back in February 2011 and provided some resistance in March 2012. It proved its strength for a second week in a row.
It is closely followed by the minor line of 83.20, which was the bottom border of a range in March, and also provided resistance in February 2011. 82.87 was the line where the BOJ intervened in September 2010, and also worked in both directions afterwards. It worked as support when the pair traded higher and is now immediate resistance.
81.80 is an update of the 82 line. It served as support for the pair at the end of March 2012 and is now strong support. Close by, 81.43 worked as a minor line in both directions, both in February and March, and is the next support line.
80.60 provided support for the pair around the same time, and served as a bouncing spot for the next moves. The round number of 80, which provided strong support in June, is the next line, and it is of high importance.
79.50, was a battleground on the way up. This is the line that was reached after the last non-stealth intervention. 78.30 capped a second recovery attempt in November, after the intervention and had an important role earlier as well, working as support. After it was broken, the rally intensified. It now switches to support.
I turn from neutral to bullish on USD/JPY.
Now that the fiscal year is over, the yen has more room to fall. In addition, fresh and critical US figures this week may provide the new fuel the dollar needs so much. Is the US economy indeed moving forward?
Further reading:
- For a broad view of all the week’s major events worldwide, read the USD outlook.
- For EUR/USD, check out the Euro to Dollar forecast.
- For GBP/USD (cable), look into the British Pound forecast.
- For the Australian dollar (Aussie), check out the AUD to USD forecast.
- For the New Zealand Dollar (kiwi), read the NZD forecast.
- For USD/CAD (loonie), check out the Canadian dollar forecast
- For the Swiss Franc, see the USD/CHF forecast.
