USD/JPY had a relatively quiet week and showed little change at the end of the week. The pair closed the week slightly higher, at 97.51. The upcoming week has a very light schedule, with just three releases. Here’s an outlook for the Japanese events and an updated technical analysis for USD/JPY.
Japanese releases did not impress last week, as Preliminary GDP missed the estimate and Core Machinery Orders posted a decline. In the US, Employment Claims looked sharp, but manufacturing numbers were weak and the week ended on a sour note as consumer sentiment data slumped.
[do action=”autoupdate” tag=”USDJPYUpdate”/]USD/JPY daily chart with support and resistance lines on it. Click to enlarge: 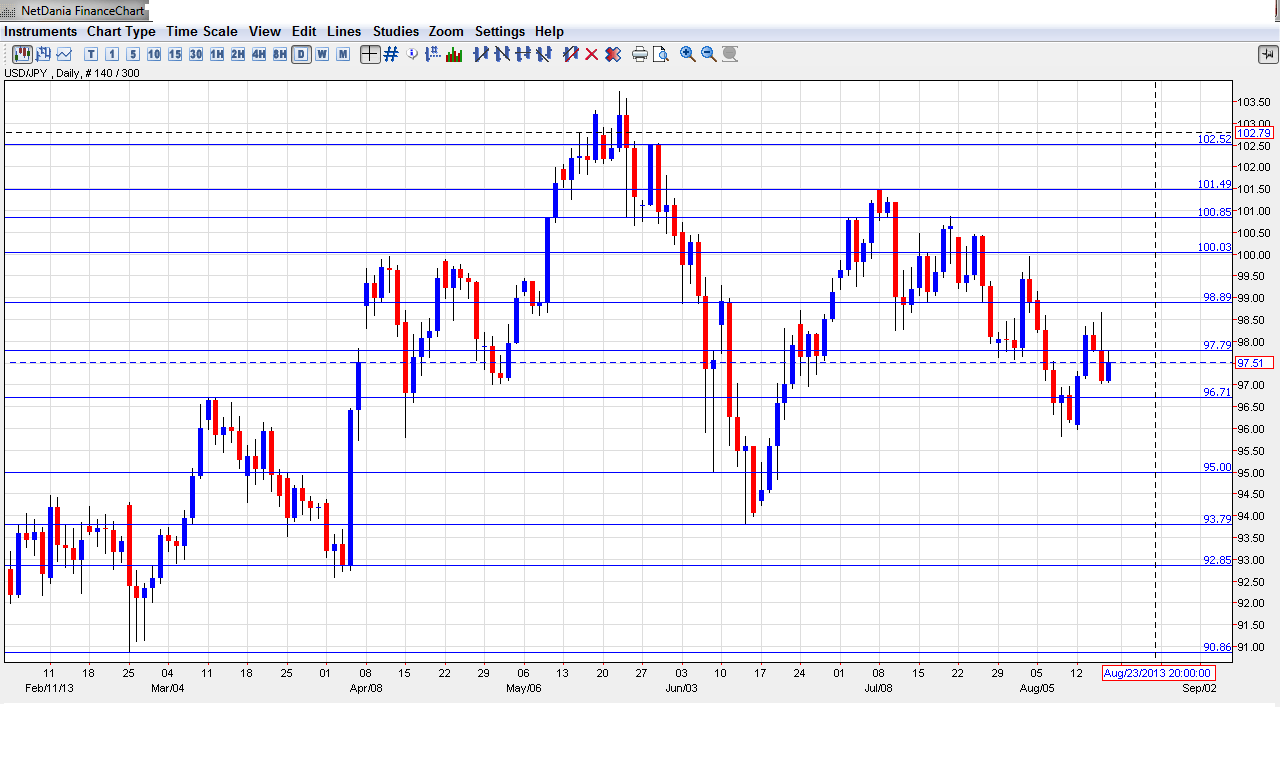
- Trade Balance: Sunday, 23:50. Trade Balance is directly linked to currency demand, since foreigners must purchase yen to buy Japanese exports. The indicator continues to post monthly deficits, although the August figure of -0.60 trillion yen was the lowest deficit we’ve seen since September 2012.
- All Industries Activity: Tuesday, 4:30. This indicator looks at the change in total value of goods and services purchased by businesses. The services portion of the indicator was released earlier this month in the Tertiary Activity Industry indicator, so this release has minor significance.
- Jackson Hole Symposium: Thursday-Saturday. The Jackson Hole Symposium in Wyoming is an important economic conference attended by central bankers, finance ministers, financial market participants and academics from around the world. With speculation that the Fed could taper QE as early as September, the conference could be prove to be a market-mover and will be carefully monitored by analysts.
*All times are GMT
USD/JPY Technical Analysis
- Technical lines from top to bottom
We begin with resistance at 102.50. This was a key resistance line in late May but has been quiet since that time.
101.44 was the post-crisis high seen in April 2009, and has not been tested since mid-July. 100.85 was busy in July as the dollar pushed above the 100 level.
The significant 100 level saw a lot of activity in July. It has strengthened as a resistance line as the pair trades at lower levels.
98.90 held firm as the pair moved higher early in the week. 97.80 was quite busy in June and in late July and is currently providing weak resistance.
96.71 has reverted back to a support role. This line could face pressure if the yen flexes some muscle.
The next support level is at the round number of 95, which was last tested in mid-June.
93.79 marked the low point of a rally by the dollar which started in mid-June and saw the pair climb to the mid-101 range in July.
92.86 saw action in early March and again in early April. The latter date marked the low point of a yen rally which saw USD/JPY climb very close to the 100 level.
The final support line for now is 90.90. This line has remained intact since late January.
I am bullish on USD/JPY
Fundamental data out of both the US and Japan was not all that strong. However, if US employment numbers continue to improve, speculation will increase about QE tapering, which is a dollar-positive event. The Federal Reserve hasn’t hinted at any imminent moves, but the markets are looking for some action on this front as early as September.
- For a broad view of all the week’s major events worldwide, read the USD outlook.
- For EUR/USD, check out the Euro to Dollar forecast.
- For GBP/USD (cable), look into the British Pound forecast.
- For the Australian dollar (Aussie), check out the AUD to USD forecast.
- For USD/CAD (loonie), check out the Canadian dollar forecast.
