The Canadian dollar lost about 80 points last week, as USD/CAD pushed above the 1.09 line and closed at 1.0921. This week has just four releases, highlighted by Manufacturing Sales. Here is an outlook on the major events and an updated technical analysis for USD/CAD.
Non Farm Payrolls met expectations in May, and the ISM Manufacturing and Services PMIs both showed improvement. In Canada, Building Permits and Ivey PMI disappointed, but Employment Change rebounded and beat the estimate.
[do action=”autoupdate” tag=”USDCADUpdate”/] USD/CAD daily chart with support and resistance lines on it.
Click to enlarge: 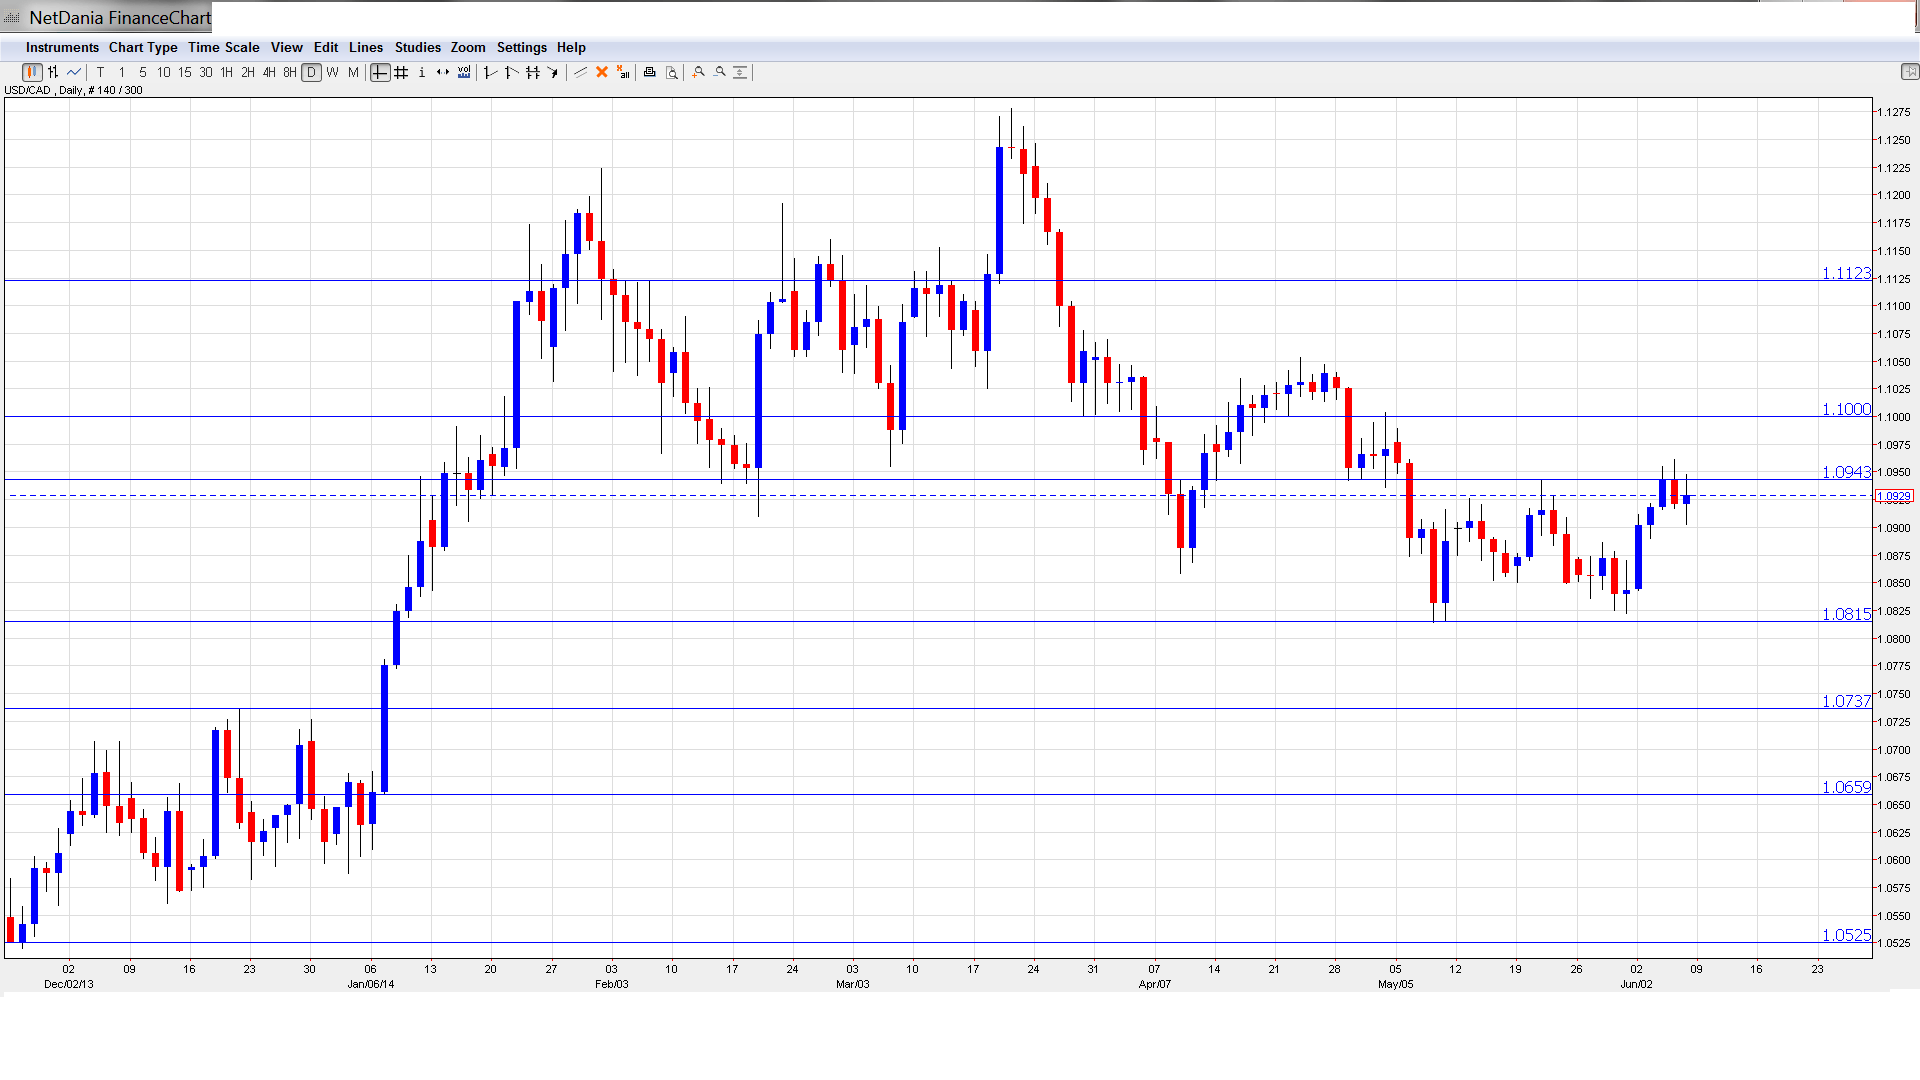
- Housing Starts: Monday, 12:15. Housing Starts is one of the most important housing indicators. In April, the indicator improved to 195 thousand, a six-month high. This easily surpassed the estimate of 177 thousand. The markets are expecting a weaker reading in the upcoming release, with an estimate of 185 thousand.
- NHPI: Thursday, 12:30. The New Housing Price Index is an important gauge of activity in the housing industry. The index has been very steady, posting two straight gains of 0.2%. The markets are not expecting much change in the May reading, with the estimate standing at 0.3%.
- BOC Governor Stephen Poloz Speaks: Thursday, 15:15. Poloz will speak in Ottawa about the BOC’s Financial System Review, a report which examines risks to the Canadian financial system. Analysts will be looking for clues as to the BOC’s future monetary policy.
- Manufacturing Sales: Friday, 12:30. Manufacturing Sales is the highlight of the week. The indicator slipped last month, posting a weak gain of 0.4%. However, this was enough to beat the estimate of 0.2%. The markets are expecting better news from the May reading, with an estimate of 0.9%. If the indicator can meet or beat this prediction, the Canadian dollar could gain some ground.
USD/CAD Technical Analysis
USD/CAD opened the week at 1.0844 and dropped to a low of 1.0843. The pair then pushed above the 1.09 line, touching a high of 1.0961 and breaking through resistance at 1.0945 (discussed last week). The pair then retracted and closed at 1.0921.
Live chart of USD/CAD: [do action=”tradingviews” pair=”USDCAD” interval=”60″/]
Technical lines, from top to bottom:
We start with resistance at 1.1369. This line was breached in October 2008 as the US dollar posted sharp gains, climbing as high as the 1.21 level. This line has remained steady since July 2009.
1.1124 remains a strong resistance line. It has held firm since late March.
The psychological barrier of 1.10 saw a lot of action in April and has strengthened as a strong resistance line.
1.0945 was breached by the pair but recovered, and starts the new week as a weak resistance level. It could see further action early in the week.
1.0815 remained in place in a support role. It has some breathing room as the pair trades at higher levels.
1.0737 was a cap in mid-2010, before the US dollar tumbled and dropped all the way into 0.93 territory.
1.0660 saw a lot of activity in the second half of December and continues to provide strong support.
1.0526 has been a strong support line since late November.
1.0422 is the final support level for now. It was a key support line in mid-November.
I am bullish on USD/CAD
US numbers have been generally positive, and Nonfarm Payrolls met expectations, pointing to stability on the employment front. Key Canadian releases have not been able to keep up, and USD/CAD could continue to move towards the key 1.10 level.
Further reading:
- For a broad view of all the week’s major events worldwide, read the USD outlook.
- For EUR/USD, check out the Euro to Dollar forecast.
- For the Japanese yen, read the USD/JPY forecast.
- For GBP/USD (cable), look into the British Pound forecast.
- For the Australian dollar (Aussie), check out the AUD to USD forecast.
- USD/CAD (loonie), check out the Canadian dollar.
