USD/CAD showed some movement in both directions, but ended the week unchanged, closing at 1.0877. This week’s highlight is Building Permits. Here is an outlook on the major events and an updated technical analysis for USD/CAD.
Canadian Employment Change and Ivey PMI tumbled in August, but the Canadian dollar managed to hold its own last week. In the US, Nonfarm Payrolls slumped to a 7-month low, while services and manufacturing PMIs beat the estimates.
[do action=”autoupdate” tag=”USDCADUpdate”/]
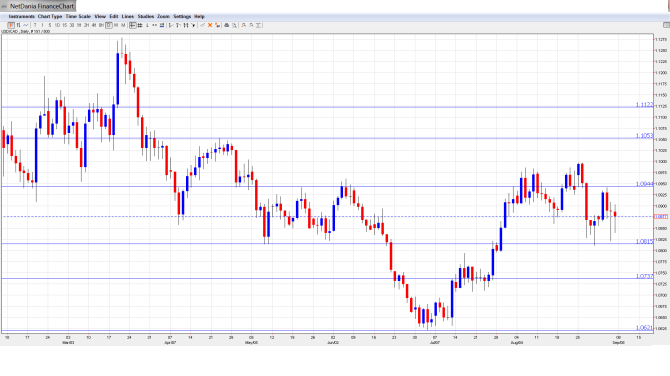
USD/CAD daily chart with support and resistance lines on it. Click to enlarge:
- Building Permits: Monday, 12:30. This is the key event of the week. The indicator has posted back-to-back gains of over 13%, easily beating the estimates. The markets are braced for a sharp downturn in the upcoming release, with an estimate of -4.2%.
- Housing Starts: Tuesday, 12:15. Housing Starts measures the number of new residential buildings and is an important gauge of the strength of the construction sector. Recent readings have looked strong, with readings of about 200 thousand. More of the same is expected in the August release, with an estimate of 197 thousand.
- Capacity Utilization Rate: Wednesday, 12:30. This indicator measures the capacity used by manufacturers and other producers. Market estimates have been very close to actual readings, and little change is expected in the August reading, with an estimate of 82.8%.
- NHPI: Thursday, 12:30. The New Housing Price Index is an important gauge of activity in the housing sector. The index has been steady, and posted a small gain of 0.2% last month, matching the forecast. Another 0.2% gain is expected in the August release.
* All times are GMT.
USD/CAD Technical Analysis
USD/CAD opened the week at 1.0877 and moved upwards, touching a high of 1.0942, as resistance held firm at 1.0944. The Canadian dollar then reversed direction and dropped to low of 1.0821. The pair closed the week at 1.0877.
Live chart of USD/CAD:
[do action=”tradingviews” pair=”USDCAD” interval=”60″/]
Technical lines, from top to bottom:
We start with resistance at 1.1369. This line was breached in October 2008 as the US dollar posted sharp gains, climbing as high as the 1.21 level. This line has remained steady since July 2009.
1.1278 has provided resistance since March. This line marked the start of a rally by the Canadian dollar, which dropped below the 1.09 level. This is followed by resistance at 1.1122.
1.1054 marked an important resistance line in April and has held firm since then.
1.0944 held firm as the Canadian dollar lost ground early last week before recovering.
1.0815 is an immediate support level. This line has been under pressure since late August as the Canadian dollar shows signs of improvement.
1.0737 marked a cap in mid-2010, before the US dollar tumbled and dropped all the way into 0.93 territory.
1.0621 marked a low point for the pair in early July. The US dollar has improved sharply since then, as the pair trades close to 1.10.
1.0526 has been a strong support line since late November.
1.0422 was a key support line in mid-November. This is the final line for now.
I am neutral on USD/CAD
The Canadian economy has not kept pace with its southern neighbor, but a stronger US economy has been good news for the Canadian exports, which has helped the Canadian dollar. With only one key Canadian event this week, US releases will be an important factor in the direction taken by USD/CAD.
Further reading:
- For a broad view of all the week’s major events worldwide, read the USD outlook.
- For EUR/USD, check out the Euro to Dollar forecast.
- For the Japanese yen, read the USD/JPY forecast.
- For GBP/USD (cable), look into the British Pound forecast.
- For the Australian dollar (Aussie), check out the AUD to USD forecast.
- USD/CAD (loonie), check out the Canadian dollar.
