GBP/USD posted strong gains for a second straight week, climbing 160 points. The pair closed the week at the 1.46 line, its highest level since February. This week’s highlights are the PMI reports. Here is an outlook on the major events moving the pound and an updated technical analysis for GBP/USD.
The dollar dropped sharply following the Fed statement, which made no mention of a June hike. US Advance GDP came in at 0.5%, short of the estimate. In the UK, Preliminary GDP posted gain of 0.4%, matching the forecast.
Updates:
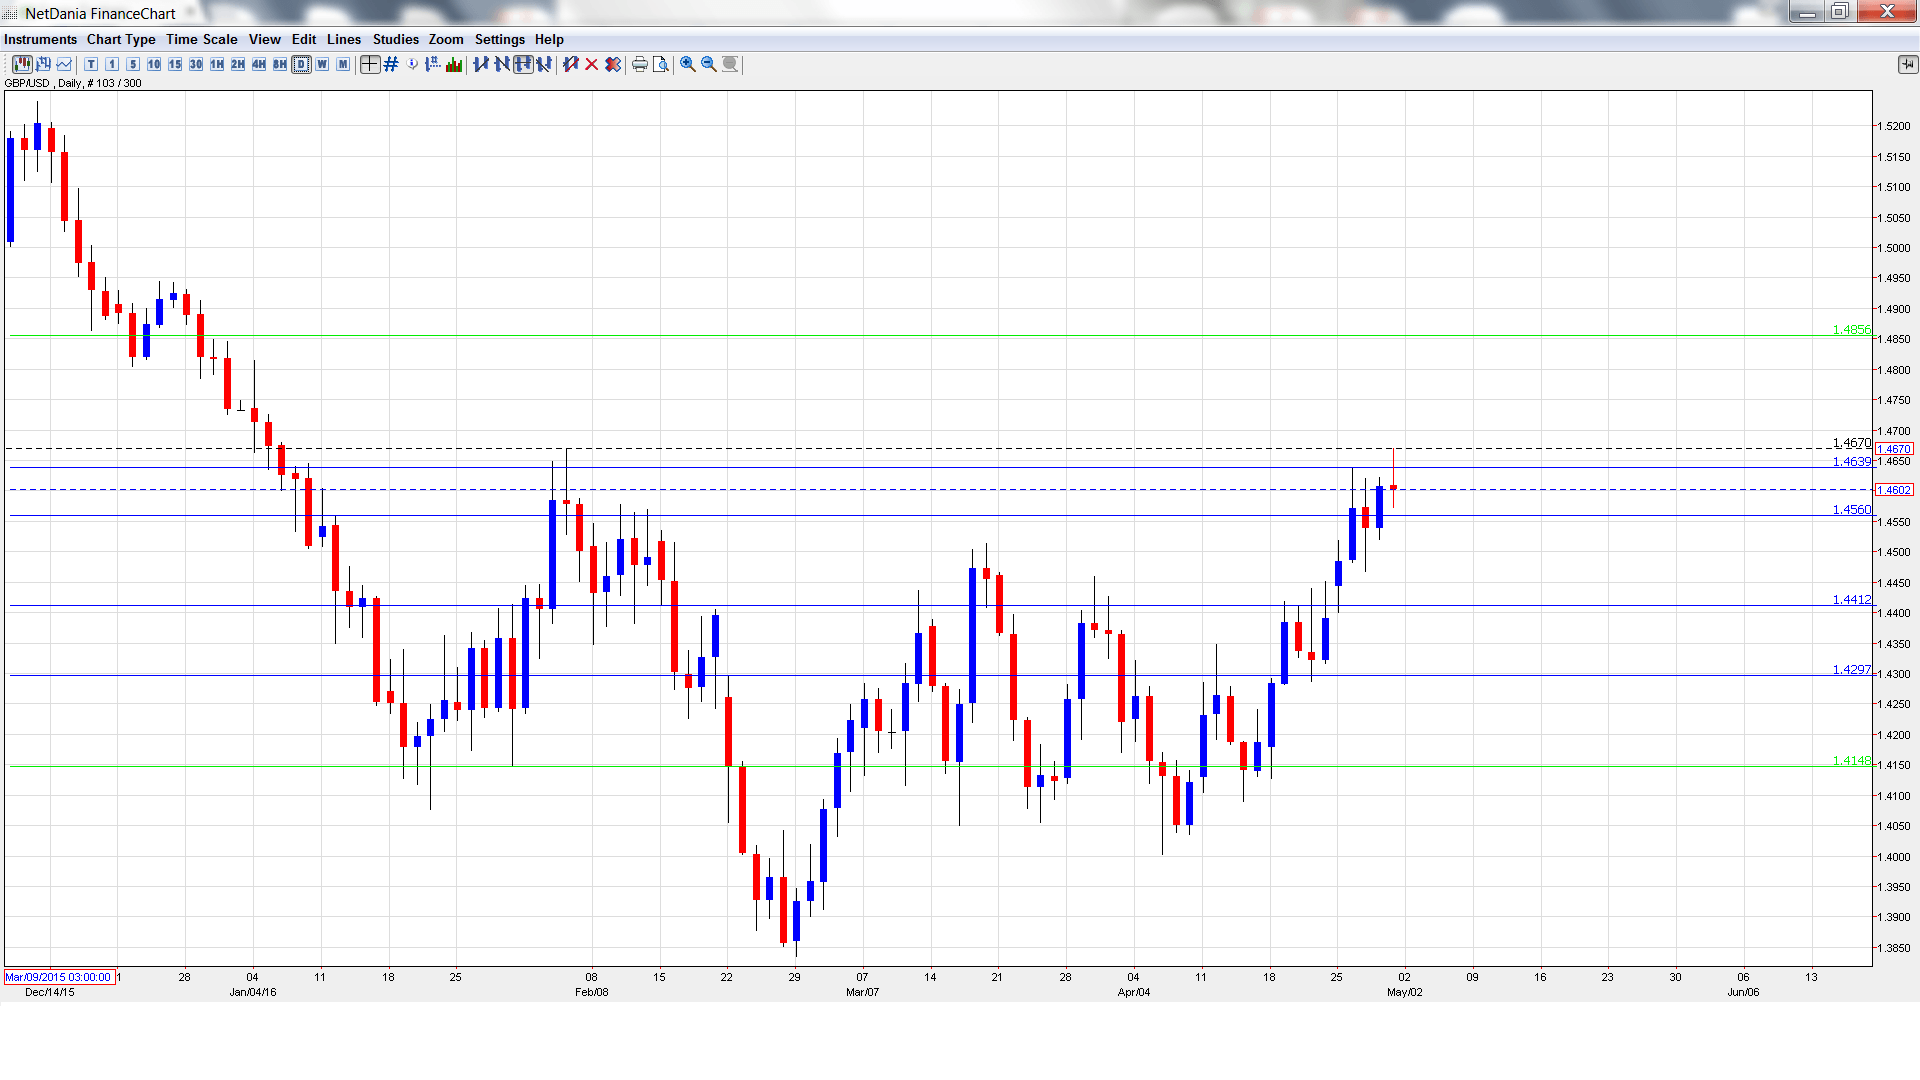
GBP/USD graph with support and resistance lines on it. Click to enlarge:
- Manufacturing PMI: Tuesday, 8:30. Manufacturing PMI showed little movement in March, with a reading of 51.0 points. This points to slight growth in the manufacturing sector. The estimate for the April report shows 51.3 points.
- BRC Shop Price Index: Tuesday, 23:01. This indicator of consumer inflation continues to post declines, and came in at -1.7% in March.
- Construction PMI: Wednesday, 8:30. The index was unchanged in March, posting a reading of 54.2 points, indicating expansion. More of the same is expected in the April report, with a forecast of 54.1 points.
- Halifax HPI: Thursday, 7:30. This housing price index provides a snapshot of the level of activity in the UK housing sector. The indicator bounced back in March with a strong gain of 2.6%, well above the estimate of 0.8%. The markets are expecting a small gain of 0.1% in April.
- Services PMI: Thursday, 8:30. Services PMI improved to 53.7 in March, within expectations. Little change is expected in the April release.
- 10-year Bond Auction: Tentative. The yield on 10-year bonds has been moving lower and dropped to 1.51% in the April auction. Will the indicator continue to move lower in the May release?
* All times are GMT
GBP/USD Technical Analysis
GBP/USD opened the week at 1.4443. The pair quickly touched a low of 1.4401, testing support at 1.4413 (discussed last week). The pair then reversed directions and climbed to a high of 1.4670. GBP/USD closed at the week at 1.4602.
Live chart of GBP/USD: [do action=”tradingviews” pair=”GBPUSD” interval=”60″/]
Technical lines from top to bottom
With GBP posting strong gains last week, we start at higher levels:
We begin with resistance at 1.4856. This line has held firm since late December.
1.4752 is next.
1.4635 has been a resistance line since early February.
1.4562 has switched to a support role following strong gains by GBP/USD.
1.4413 was a cap in January.
1.4297 is protecting the 1.43 line.
1.4148 is the final support level for now.
I am bearish on GBP/USD.
The pound has looked sharp in recent weeks, but it’s been more of a case of broad dollar weakness rather than strong UK numbers. Will we see a downward correction? With the Federal Reserve out of the spotlight, the pound could lose ground if US indicators outperform UK numbers this week.
In our latest podcast we ask: is China out of the woods?
Follow us on Sticher or on iTunes
Further reading:
- For a broad view of all the week’s major events worldwide, read the USD outlook.
- For EUR/USD, check out the Euro to Dollar forecast.
- For the Japanese yen, read the USD/JPY forecast.
- For the kiwi, see the NZD/USD forecast.
- For the Australian dollar (Aussie), check out the AUD to USD forecast.
- For the Canadian dollar (loonie), check out the USD to CAD forecast.
