- Buying pressure in AUD/USD pair remains 0.7430 territories will confirm consistent-bullish bias.
- Oversold MACD implies a wait-and-watch approach before planning determinant bids.
- Market prevailing trend predicted unchanged downward direction in pair.
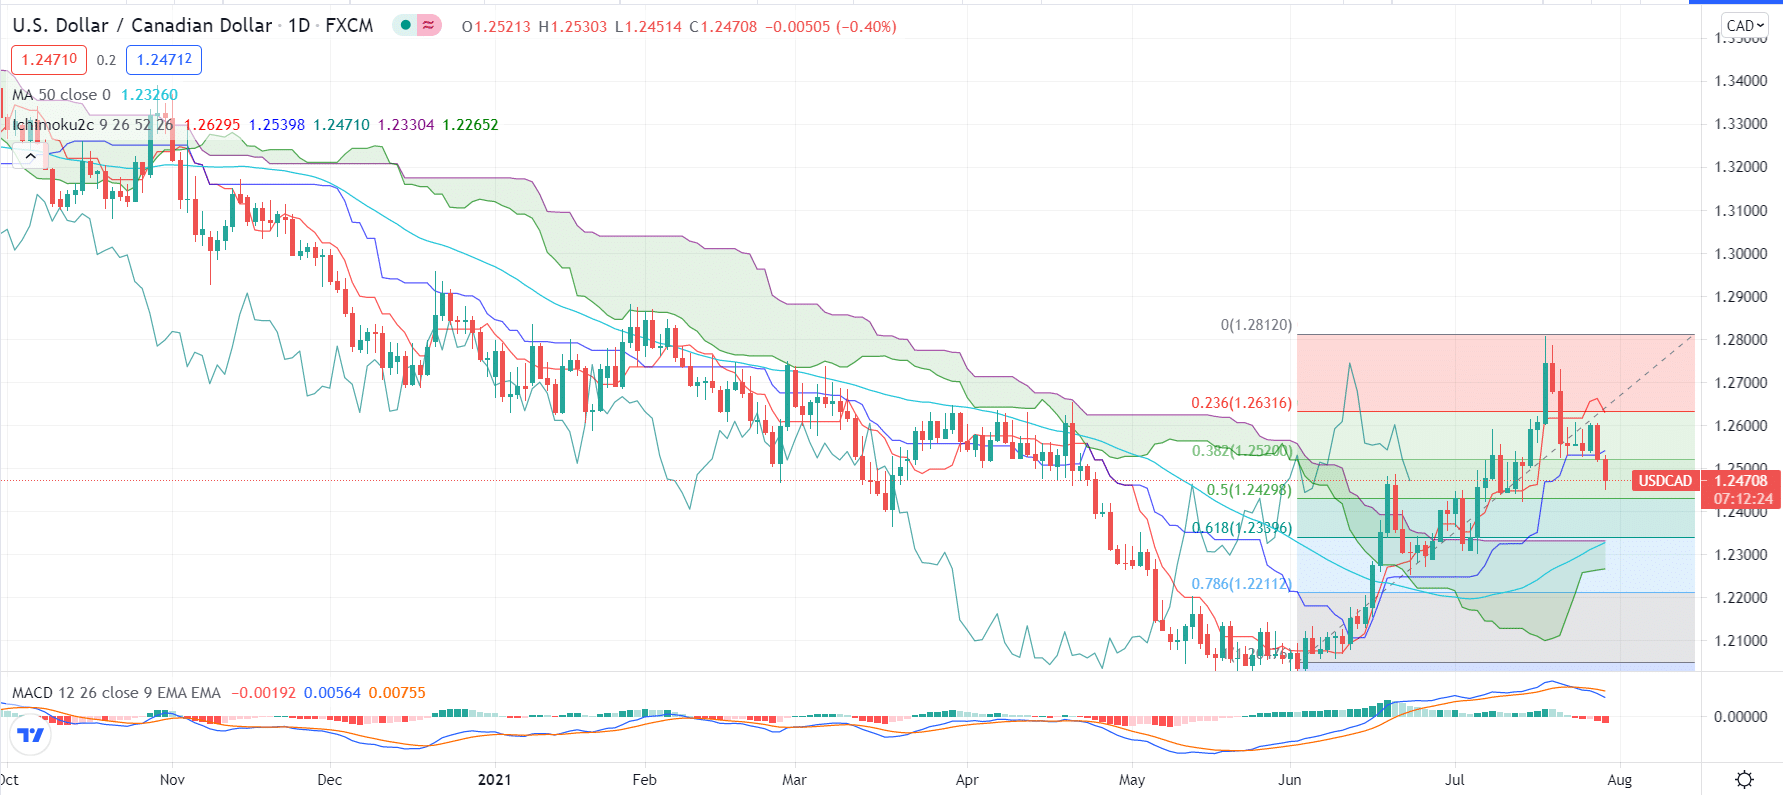
The AUD/USD price crossed the red Tenkan-sen line on Thursday’s opening. It predicted that the pair finally snaps the Ichimoku line. Since mid-June, the Ichimoku line held the bulls under its pressure. It’s now challenging the nearby 0.7400 resistant territories.
–Are you interested to learn more about automated trading? Check our detailed guide-
The RSI is presenting optimistic momentum by supporting the bullish action above the 8-month downfall at 0.7288 territories. As the indicators are in the process of creating new higher highs, several precautions are still needed. The AUD/USD maintains a sideway trajectory that eases below its neutral level of 50.
The oversold Moving Average Convergence Divergence (MACD) provides stretched selling chances which allow bulls to become more opportunists for further upside movements. The upside reversal in MACD encourages the traders, but several breaks in the positive territory risk a strong bullish signal.
The 50-period and 200-period SMAs accomplished a death cross for the first time since 2018 is considered a warning. It flags a definitive negative trend reversal for the AUDUSD.

The short-term analysis predicted the pair price to close above the 0.7400-0.7430 territory on Thursday. The technical analysis sums up the 20-period SMA and the 23.6% Fibonacci retracement to the low of 0.7890-0.7288. The bulls have chances to lead towards the 38.2% Fibonacci of 0.7518 if their efforts go in the right direction. It could be possible unless the 0.7475 restriction barrier caps the rally. Steeper increases could achieve the 0.7559 territory in 50-period SMA. But, a determining action above the 50% Fibonacci of 0.7589 and 200-period SMA could prove to be a significant success of AUD/USD. There are chances that any down stick in the MACD could drag the AUD/USD pair towards the 0.7350 horizontal support level.
–Are you interested to learn more about forex signals? Check our detailed guide-
As seen in November, the 0.72288 low will gain the attraction back. A break in 0.72288 could find immediate support within the 0.7255-0.7230 region. If the immediate support doesn’t appear, the pair have chances to stretch its South Trend towards the restrictive line from January around 0.7130 territories.
Looking to trade forex now? Invest at eToro!
67% of retail investor accounts lose money when trading CFDs with this provider. You should consider whether you can afford to take the high risk of losing your money.
