AUD/USD reversed directions last week, as the pair jumped 150 points. AUD/USD closed the week just above the 0.77 line, its highest level since June 2015. This week has six events on the calendar. Here is an outlook on the major market-movers and an updated technical analysis for AUD/USD.
Australian releases were strong, with business confidence and employment numbers posting strong gains. Strong Chinese exports also bolstered the Aussie. In the US, both retail sales and inflation reports missed expectations, which has likely taken an April rate hike off the table. As well, consumer confidence numbers were well short of the estimate.
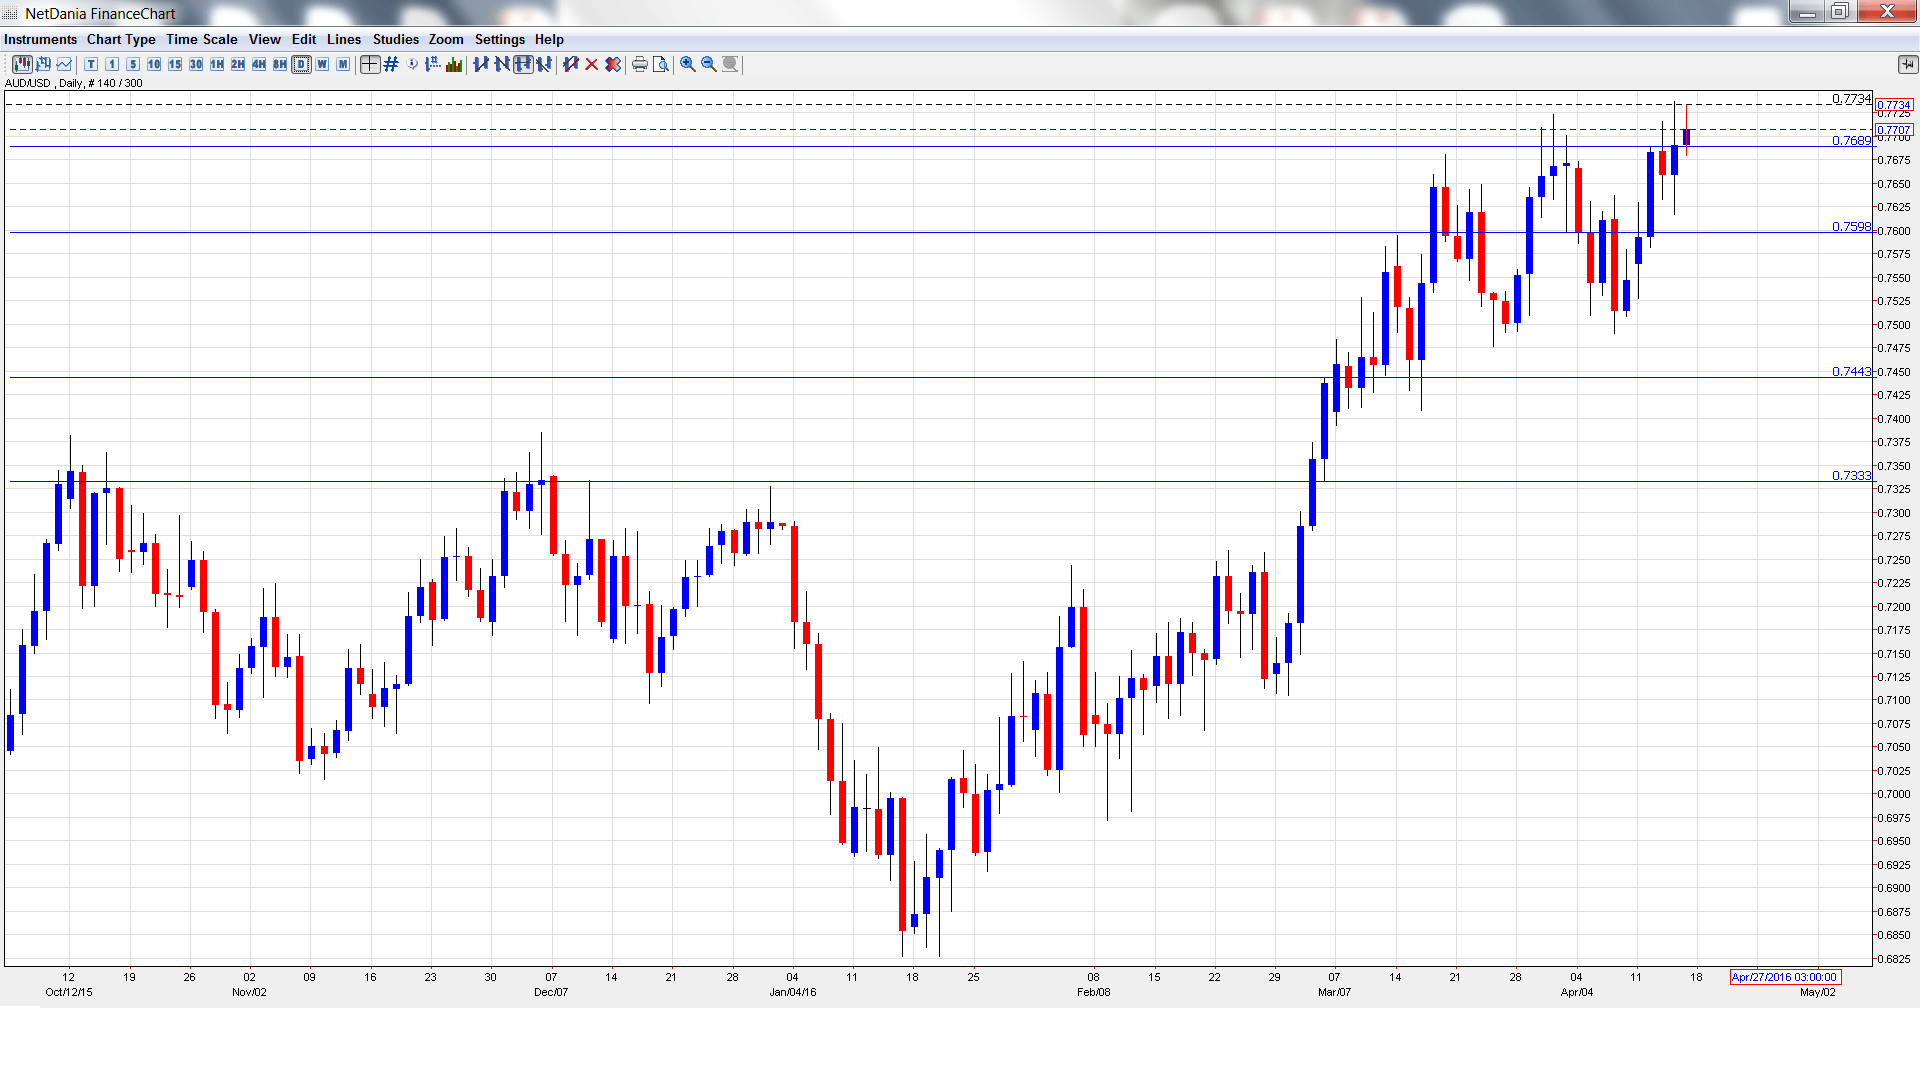
[do action=”autoupdate” tag=”AUDUSDUpdate”/]AUD/USD graph with support and resistance lines on it. Click to enlarge:
- New Motor Vehicle Sales: Monday, 1:30. This indicator is an important gauge of consumer spending, as a new motor vehicle is one of the most expensive purchases a consumer will make. The indicator posted a small decline of 0.1% in March.
- CB Leading Index: Monday, 14:30. The index posted a decline of 0.4% in February marking a second straight decline.
- Monetary Policy Meeting Minutes: Tuesday, 1:30. The minutes will provide details of the recent policy meeting, at which the RBA held rates at 2.00%, but added that it was prepared to lower rates if necessary.
- RBA Governor Glenn Stevens Speaks: Tuesday, 13:30. Stevens will deliver remarks at a conference in New York. Analysts will be listening closely for any clues as to future monetary moves by the RBA.
- MI Leading Index: Wednesday, 00:30. The index continues to struggle and has not posted a gain since October 2015. In February, the indicator posted a decline of 0.2%.
- NAB Quarterly Business Confidence: Thursday, 1:30.This key indicator is released every quarter, which magnifies the impact of each reading. In the fourth quarter, the indicator improved to 4 points, compared to a flat reading of zero in the third quarter. Will we see another solid gain in the Q1 report?
* All times are GMT
AUD/USD Technical Analysis
AUD/USD opened the week at 0.7563 and quickly touched a high of 0.7527. It was all uphill from there, as the pair climbed to a high of 0.7737, breaking above resistance at 0.7692 (discussed last week). AUD/USD closed the week at 0.7707.
Live chart of AUD/USD: [do action=”tradingviews” pair=”AUDUSD” interval=”60″/]
Technical lines from top to bottom:
We start with resistance at 0.8163.
0.8025 has held firm since May 2015.
0.7886 is next.
0.7798 was an important resistance line for much of June 2015.
0.7692 has switched to a support role following strong gains by AUD/USD.
0.7597 remains busy and also switched to support.
0.7438 is the next support level.
0.7334 was a cap December 2015. It is the final support level for now.
I am bearish on AUD/USD
With an uncertain global economic environment, the safe-haven US dollar remains an attractive asset for many investors. The oil producers meeting in Doha is not expected to end with any significant agreements, and this could send oil prices lower and boost the greenback.
In our latest podcast go on a Euro-trip
Follow us on Sticher or on iTunes
Further reading:
- For a broad view of all the week’s major events worldwide, read the USD outlook.
- For EUR/USD, check out the Euro to Dollar forecast.
- For the Japanese yen, read the USD/JPY forecast.
- For GBP/USD (cable), look into the British Pound forecast.
- For the Canadian dollar (loonie), check out the Canadian dollar forecast.
- For the kiwi, see the NZD/USD forecast
