AUD/USD posted gains for a second straight week, as the pair closed the week just above the 0.77 line. This week’s key event is CPI. Here is an outlook on the major market-movers and an updated technical analysis for AUD/USD.
The failed oil summit in Qatar resulted in strong volatility for the Australian dollar, which lost ground after the meeting but then rebounded with strong gains as oil prices stabilized. In the US, jobless claims slid, but manufacturing and housing reports missed expectations.
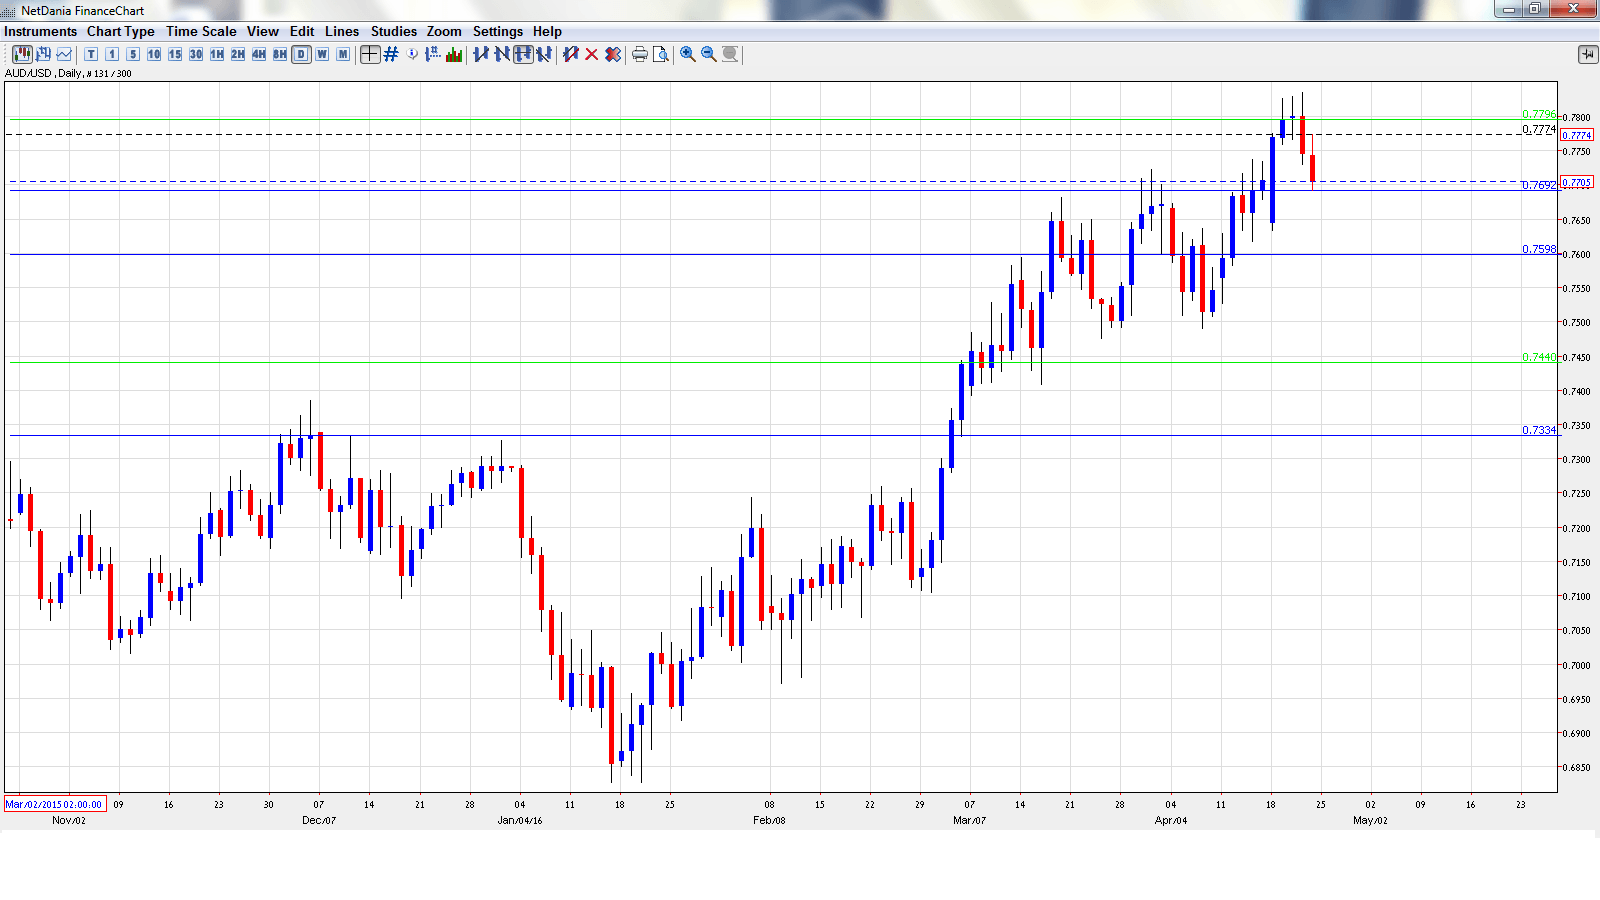
[do action=”autoupdate” tag=”AUDUSDUpdate”/]AUD/USD graph with support and resistance lines on it. Click to enlarge:
- CPI: Wednesday, 1:30. CPI is the primary gauge of consumer inflation. The indicator dipped to 0.4% in the fourth quarter, within expectations. The downswing is expected to continue in Q1, with an estimate of 0.2%.
- Trimmed Mean CPI: Wednesday, 1:30. This indicator excludes the most volatile items which comprise CPI. The indicator improved in Q4 with a gain of 0.6%, edging above the forecast of 0.5%. The estimate for the Q1 report stands at 0.5%.
- Import Prices: Thursday, 1:30. After some strong gains, the indicator slipped in Q4, posting a decline of -0.3%. The downward trend is expected to continue in the first quarter, with the markets bracing for a reading of -0.9%.
- PPI: Friday, 1:30. PPI is an important gauge of inflation in the manufacturing sector. The index dipped to 0.3% in Q4, short of the forecast of 0.6%. The estimate for the index stands at 0.2%.
- Private Sector Credit: Friday, 1:30. Credit readings are closely linked to spending levels, a key driver of economic activity. The indicator has been steady, and edged up to 0.6% in February, which was within expectations. The estimate for the March estimate is 0.5%.
- RBA Assistant Governor Guy Debelle Speaks: Friday, 3:45. Debelle will speak at a financial meeting in Jakarta, Indonesia. A speech which is more hawkish than expected is bullish for the Australian dollar.
* All times are GMT
AUD/USD Technical Analysis
AUD/USD opened the week at 0.7634 and touched a low of 0.7588. The pair then posted strong gains and climbed to a high of 0.7839, testing resistance at 0.7798 (discussed last week). AUD/USD closed the week at 0.7710.
Live chart of AUD/USD: [do action=”tradingviews” pair=”AUDUSD” interval=”60″/]
Technical lines from top to bottom:
We begin with resistance at 0.8163.
0.8025 has held firm since May 2015.
0.7886 is next.
0.7798 was an important resistance line for much of June 2015. It was tested last week.
0.7692 has switched to a support role following strong gains by AUD/USD.
0.7597 has some breathing room in support following gains by AUD/USD.
0.7438 is the next support level.
0.7334 was a cap December 2015. It is the final support level for now.
I am bearish on AUD/USD
US employment numbers continue to impress, and if inflation levels pick up, a June rate hike is a serious possibility. With the RBA still talking about a rate cut, monetary divergence favors the US dollar.
In our latest podcast we ask: is China out of the woods?
Follow us on Sticher or on iTunes
Further reading:
- For a broad view of all the week’s major events worldwide, read the USD outlook.
- For EUR/USD, check out the Euro to Dollar forecast.
- For the Japanese yen, read the USD/JPY forecast.
- For GBP/USD (cable), look into the British Pound forecast.
- For the Canadian dollar (loonie), check out the Canadian dollar forecast.
- For the kiwi, see the NZD/USD forecast
