AUD/USD dropped 90 points last week, as the pair closed just above the 0.75 line. This week has six events on the calendar. Here is an outlook on the major market-movers and an updated technical analysis for AUD/USD.
The US dollar gained ground thanks to hawkish comments released by various Fed officials, leaving an April hike a real possibility and contrasting the very dovish sentiment aired in the decision from the previous week. US Final GDP beat expectations with a gain of 1.4% in the four quarter.
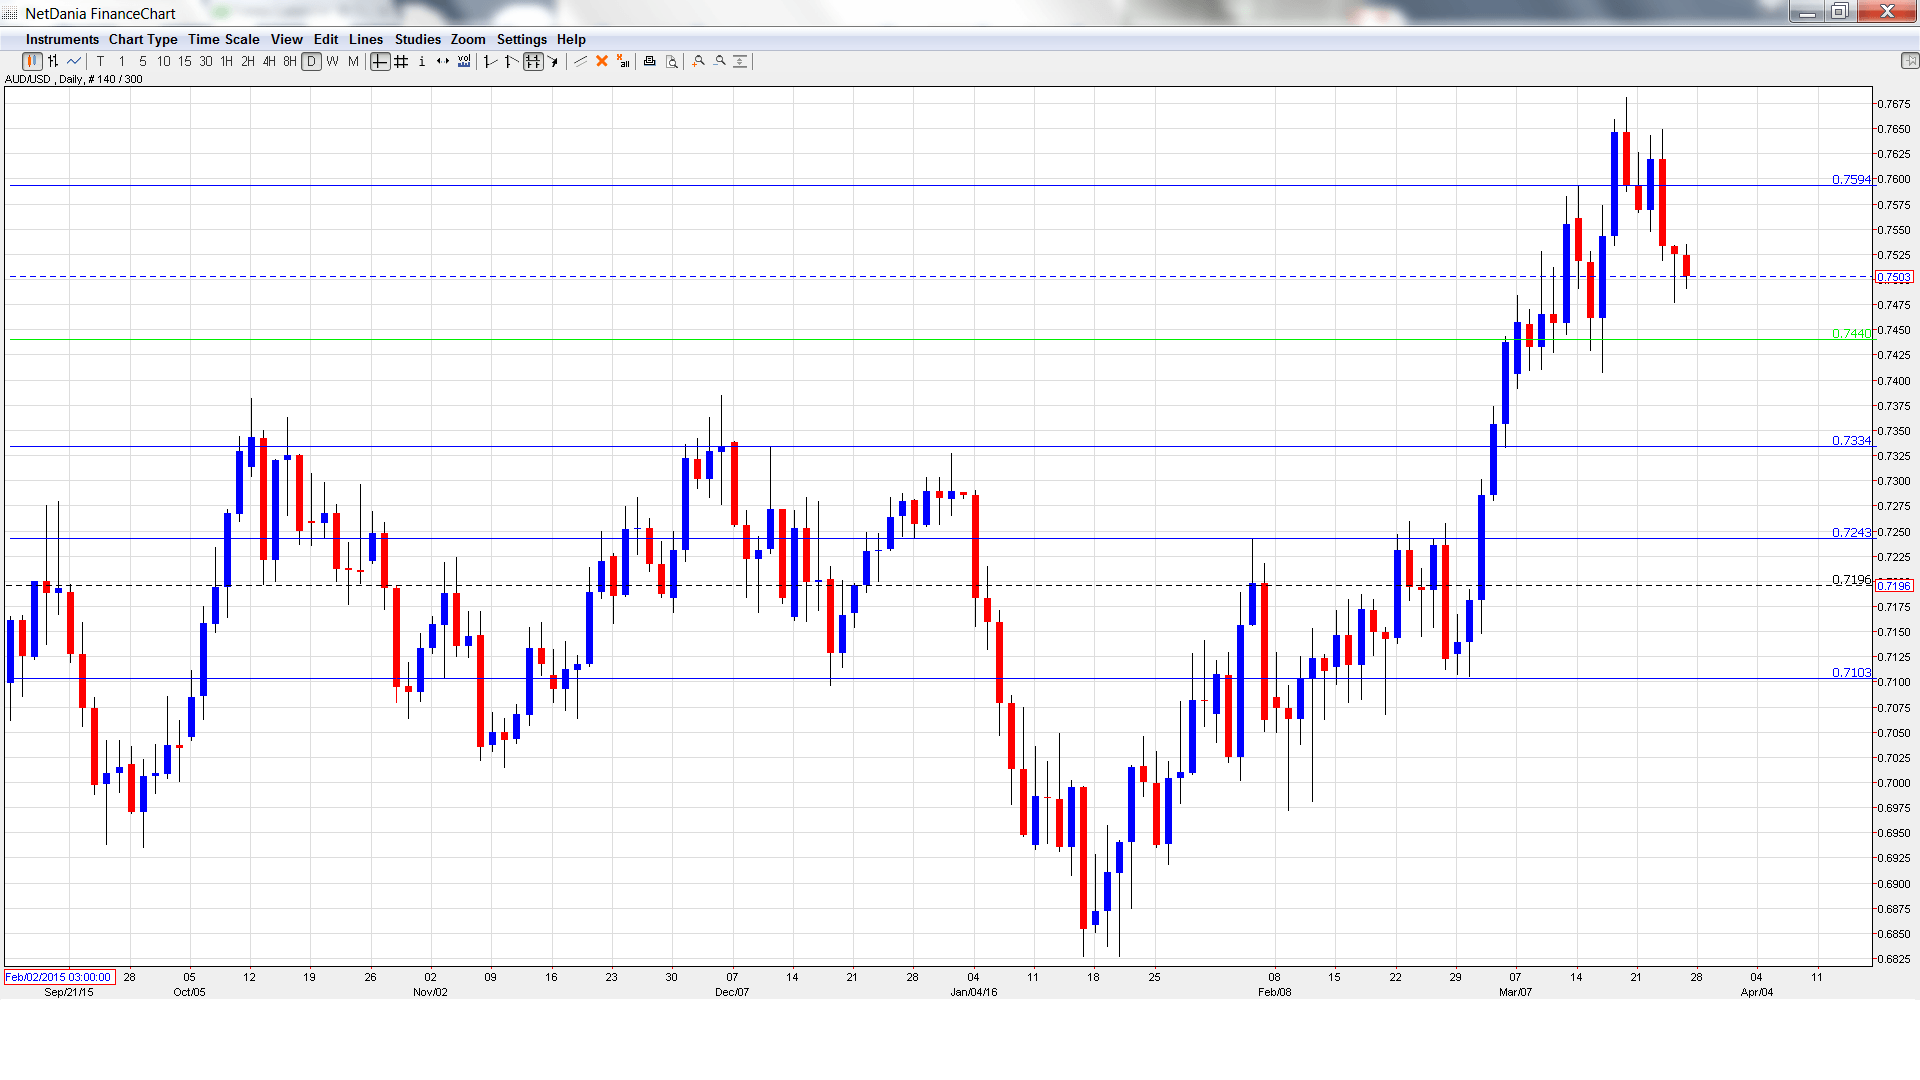
[do action=”autoupdate” tag=”AUDUSDUpdate”/]AUD/USD graph with support and resistance lines on it. Click to enlarge:
- HIA New Home Sales: Thursday, 00:00. This indicator provides a snapshot of the strength of the housing sector. In January, the indicator posted a gain of 3.1%, compared to a 6.0% gain a month earlier.
- Private Sector Credit: Thursday, 00:30. Private Sector Credit has been very steady, posting two straight readings of 0.5%. Another reading of 0.5% is forecast for the upcoming release.
- AIG Manufacturing Index: Thursday, 22:30. The indicator continues to point to expansion and improved to 53.5 points in February. Will the upswing continue in the March report?
- Chinese Manufacturing PMI: Friday, 1:00. This PMI has been pointing to contraction, underscoring weakness in the manufacturing sector due to the Chinese slowdown. The index dipped to 49.0 points in February, and another weak reading is expected in March, with an estimate of 49.3 points.
- Caixin Manufacturing PMI: Friday, 1:45. This PMI has not indicated expansion since February 2015, indicating a manufacturing sector in trouble. The estimate for March stands at 48.3 points.
- Commodity Prices: Friday, 5:30. Commodity Prices continues to post sharp declines, as weak global conditions have resulted in diminished demand for Australian exports. The February reading came in at -21.6%, and another sharp drop is expected in March.
* All times are GMT
AUD/USD Technical Analysis
AUD/USD started the week at 0.7593 and climbed to a high of 0.7649, as resistance held at 0.7692 (discussed last week). The pair then reversed sharply and dropped to a low of 0.7477. AUD/USD closed the week at 0.7503.
Live chart of AUD/USD: [do action=”tradingviews” pair=”AUDUSD” interval=”60″/]
Technical lines from top to bottom:
We start with resistance at 0.8025.
0.7886 was last breached in late May 2015.
0.7798 was an important resistance line for much of June 2015.
0.7692 held firm as the pair pushed upwards before retracting.
0.7597 is next.
0.7438 is an immediate support level.
0.7334 was a cap in mid-December.
0.7243 is next.
The round number of 0.71 is the final support level for now.
I am bearish on AUD/USD
The flurry of hawkish statements from Fed members last week indicates that the Fed is actually not so dovish, which is bullish for the US dollar. We’ll hear from Janet Yellen next week, and the US dollar could gain ground if she leaves the door open to an April or June rate hike.
In our latest podcast we crunch some commodities
Follow us on Sticher or on iTunes
Further reading:
- For a broad view of all the week’s major events worldwide, read the USD outlook.
- For EUR/USD, check out the Euro to Dollar forecast.
- For the Japanese yen, read the USD/JPY forecast.
- For GBP/USD (cable), look into the British Pound forecast.
- For the Canadian dollar (loonie), check out the Canadian dollar forecast.
- For the kiwi, see the NZD/USD forecast
