Double tops and double bottoms are falling into the reversal patterns category and they are extremely common, especially on the lower time frames. However, I would not look lower than the hourly chart for treating a double top/bottom because sometimes high volatility levels especially on the currency markets make such patterns shaky.
Like mentioned above, a double top/bottom is a powerful reversal pattern and because of that traders are looking all the time for clues such a pattern might form. Well, this is the biggest problem with this pattern, as many times price is giving the impression a double top/bottom is formed, only for it to be broken without any resistance/support to be offered. However, there are some clues a trader should look for in order to distinguish between a fake and a real double top/bottom.
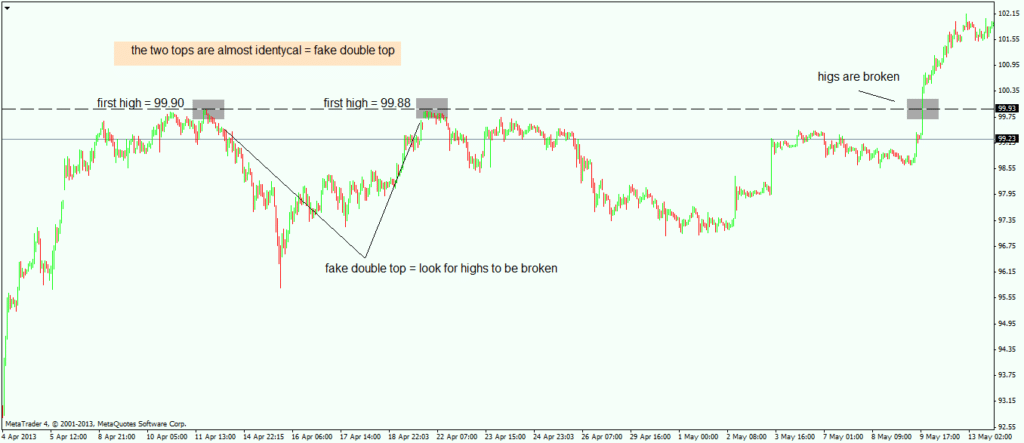
Firstly, it should be mentioned that a double top/bottom is referring to the area price reverses from, and, depending on the time frame the pattern appears on, this area might vary from tens of pips to even a hundred pips (in the case of currency markets). That being the case, when price is making a possible double top/bottom and the price for the two possible tops/bottoms is almost identical, then that pattern most likely is a fake one and price normally should turn and break those highs.
Recently, on the currency markets, we had such a situation, and if a trader knew the things described on the previous paragraph most likely the outcome of treating that pattern would be different.
The example refers to the usdjpy pair for the first time when it broke the 100 level this year. Looking at he chart below and you can see price is making a run at the 100 level, marking a maximum value of 99.90, then reverses sharply. A second attempt follows with price making almost the same top, this time 99.88, and a sharp reversal follows. Whenever the two tops/bottoms (in this case tops) are so close, almost identical, this is a clue this pattern is most likely a fake double top and normally highs should be broken, like it was the case in our usdjpy example here.
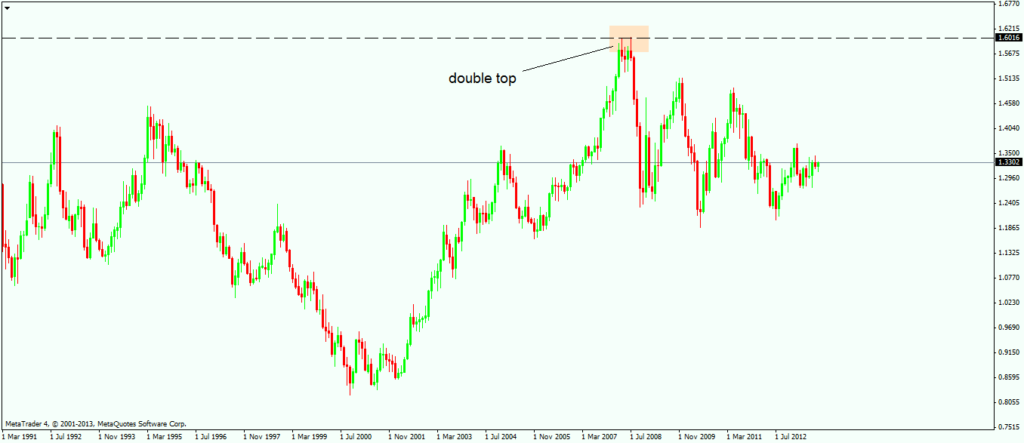
Secondly, when trying to see if a double top/bottom is a real or a fake one, the trader should take into consideration the time element. The bigger the time between the two possible tops/bottoms, the higher the chances this move is a fake move. The lower the time between the two possible tops/bottoms, the higher the changes this move is a real move. The example below shows the eurusd monthly chart with the reversal from the 2008 higher, when price was above the 1.60 level. The time taken for this double top to form is assuring us it is not a fake move.
All in all, while double tops/bottoms are powerful reversal patterns, because of the fact that they appear to form quite often, failing to properly identify them can make the difference between a successful trader and one that it is still striving for success.
