- Bitcoin price jumped above $36,000 but failed to sustain the uptrend, revisiting $34,000.
- BTC’s transaction history on-chain metric by IntoTheBlock emphasizes the ongoing consolidation.
Bitcoin price has firmly held to the support at $34,000 following the recovery from levels slightly under $30,000. The bellwether cryptocurrency has mainly consolidated between this support and the range resistance at $36,000.
On Tuesday, Bitcoin price lifted above $35,000 and stepped slightly past $36,000. The move excited many investors, but Bitcoin failed to sustain the uptrend, perhaps due to the negative Twitter sentiment as reported by Santiment.
Where is Bitcoin price headed?
The 12-hour chart shows BTC trading in a rectangle. This technical pattern shows ranging prices between crucial support and resistance levels. Traders can buy at the support and sell at the resistance or wait for a breakout above or below the pattern while employing the measuring principle.
Rectangles also validate periods of indecision in the market where bulls and bears are equally powerful. The pattern will either end in an uptrend or a downtrend, depending and who is the stronger.
BTC/USD 12-hour chart highlights market indecision
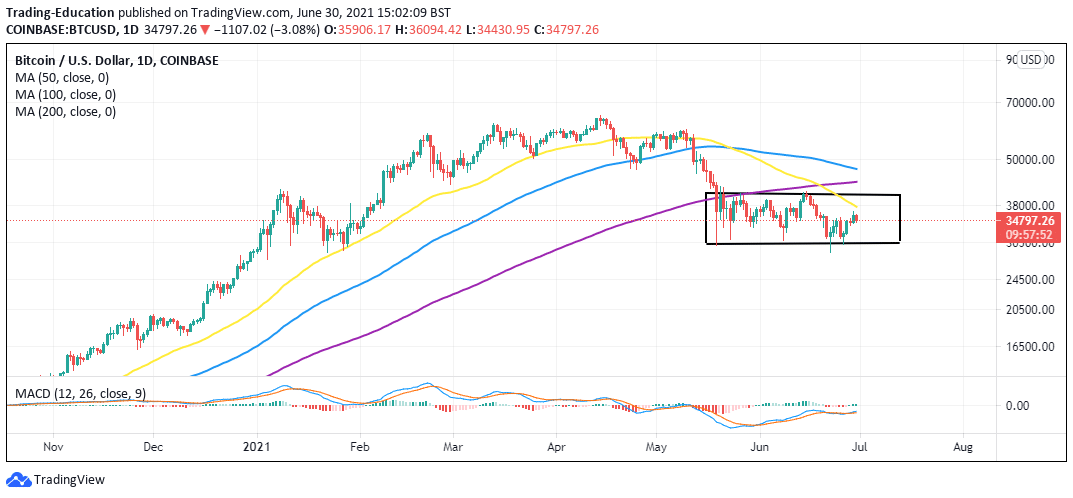
The rectangle pattern well illustrates the concept of supply and demand. If bulls are resilient, a break above the resistance will culminate in Bitcoin price lifting above $40,000. On the other hand, cracking the support will validate the downtrend continuing below $30,000.
IntoTheBlock’s In/Out of the Money Around Price (IOMAP) on-chain model vividly emphasizes the consolidation. For instance, an immense seller congestion zone has been revealed between $34,698 and $35,707. Here, 1.12 million addresses previously bought roughly 469 million BTC. While this is the most robust resistance, the IOMAP shows other relatively strong hurdles that may continue to hamper Bitcoin price recovery.
On the downside, Bitcoin appears to be sitting on top of densely saturated support areas. The region between $32,616 and $33,625 holds nearly 717,000 addresses currently profiting from approximately 531 million BTC purchased in the range.
Bitcoin price IOMAP model emphasizes market consolidation
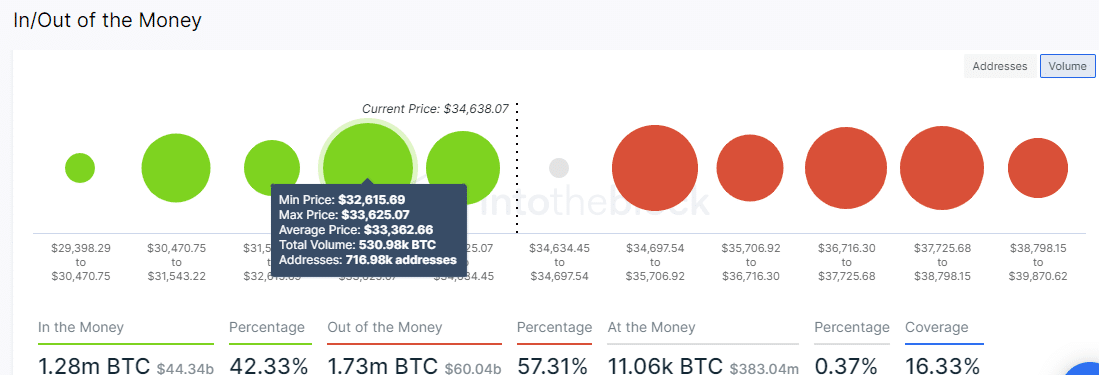
If this support holds in the near term, Bitcoin price will likely remain in the ranging trend. A break above the resistance discussed above may validate a massive uptick in price to levels beyond $40,000. On the other hand, closing the day above the support will give bears a leeway to push their agenda for losses toward $30,000 and perhaps explore levels further down.
It is worth mentioning that the Moving Average Convergence Divergence (MACD) indicator has a bullish impulse, inferring that bulls could win the tug of war. As the MACD moves closer to the zero line, the bullish grip tightens, thus adding weight to the tail force and bolstering Bitcoin price.
Looking to buy or trade Bitcoin now? Invest at eToro!
Capital at risk