The Canadian dollar found itself on the retreat. Housing and employment data are the main events this week. Here’s an outlook for the Canadian events and an updated technical analysis for USD/CAD.
Last week, Canadian economy expanded in January by 0.1% in line with expectations although in a more moderate pace than the 0.5% growth rate in December. The relatively slow growth rate could be contributed to the budget cuts inflicted by the government. Will the Canadian market turn to produce substantial growth in the coming months?
Updates: USD/CAD is up slightly, trading at 0.9985. The markets are awaiting the release of key employment figures later today.
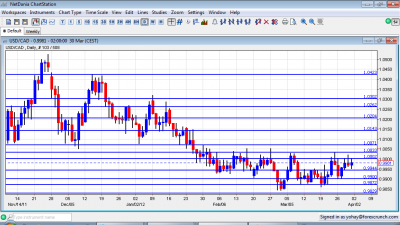
USD/CAD daily chart with support and resistance lines on it. Click to enlarge:
- Mark Carney speaks: Monday, 16:30. BOC Governor Mark Carney is scheduled to speak in Waterloo. His words can create volatility in the market.
- Jean Boivin speaks: Wednesday, 16:10. BOC Deputy Governor is scheduled to speak in Toronto.
- Building Permits: Thursday, 12:30. The Canadian building permits plunged 12.3% in January following the strong surge of 10.5% in December. The biggest decline occurred in multi-family homes. Nevertheless costs of housing dropped in the fourth quarter of 2011 making it more affordable for Canadian consumers.
- Employment data: Thursday, 12:30. Canadian Job market has contracted in February by 2,800 jobs following 2,300 gain in the previous month. This reading was much lower than the 14,200 surge anticipated by analysts. Despite these negative figures the job market is improving with more full-time workers and a steady unemployment rate of 7.4%.
- Ivey PMI: Thursday, 14:00. Canadian PMI index on business conditions surged in February to 66.5 beating expectations of 62.1 and following64.1 in January. This strong reading indicates a robust recovery in the Canadian economy.
* All times are GMT.
USD/CAD Technical Analysis
Dollar/CAD started the week with a dip to the 0.99 level (mentioned last week). It then changed direction and rose towards the parity line before closing at 0.9981.
Technical lines, from top to bottom:
1.0423 is a stubborn line in the distance. It capped the pair at the end of 2011. The round number of 1.03 was the peak of a move upwards seen in November 2010 and has found new strength after working as a cap in January 2012.
1.0263 is the peak of surges during October, November and December, but was shattered after the move higher. It’s far at the moment. The round figure of 1.02 was a cushion when the pair dropped in November, and also the 2009 trough. It is weaker now but remains pivotal.
1.0143 was a swing low in September and worked as resistance several times afterwards. Closer to parity, 1.0070 provided support around the turn of the year, and is now closer.
1.0030 capped the pair twice in March 2012 and proved to be strong. The very round number of USD/CAD parity is a clear line of course, and was a line of battle that eventually saw the pair fall lower.
Under parity, we have a new line at 0.9950. It served as a top border to range trading in March 2012. The round number of 0.99 provided support on a fall during October and also served as resistance back in June. It is now a pivotal line in the middle of the range.
0.9870 was a trough reached once and challenged afterwards, and serves a bottom border of the range. 0.9830 provided support for the pair during September and is now stronger after a first attempt to breach it failed.
0.9780, where the current run began is the next and important support line. It is closely followed by 0.9736, which provided support during August 2011.
The veteran 0.9667 line worked as support at the beginning of 2011 and then for several months during the spring. It is a very clear and strong line on the chart. 0.9550 worked as support during April and also June and is minor now.
0.9406 was the trough in July 2011 and is the final frontier for now. Below this line, its back to 2007.
I turn from bullish to neutral on USD/CAD.
While high oil prices still support the Canadian dollar, the situation inside Canada is a bit more shaky. Unless job figures are a great positive surprise, the loonie will likely float in the same area for another week.
Further reading:
- For a broad view of all the week’s major events worldwide, read the USD outlook.
- For EUR/USD, check out the Euro to Dollar forecast.
- For the Japanese yen, read the USD/JPY forecast.
- For GBP/USD (cable), look into the British Pound forecast.
- For the Australian dollar (Aussie), check out the AUD to USD forecast.
- For the New Zealand Dollar (kiwi), read the NZD forecast.
- For USD/CAD (loonie), check out the Canadian dollar forecast
- For the Swiss Franc, see the USD/CHF forecast
