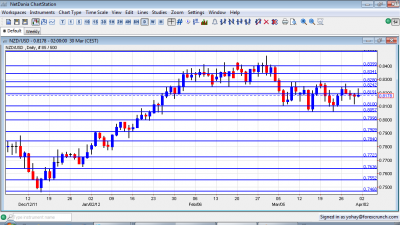
The kiwi remained in the tight range that characterized it so for. Will the new quarter send it breaking out of range? The calendar is quite light, so the outlook leans on the technical analysis for NZD/USD.
New Zealand’s trade balance surplus was certainly encouraging for the kiwi, and so was the improving RBNZ Business Confidence. On the other hand, the housing sector remains vulnerable as seen by the dropping building consents. Where is the economy headed?
Updates: NZD/USD is steady, trading at 81.42.
NZD/USD daily chart with support and resistance lines on it. Click to enlarge:
- ANZ Commodity Prices: Tuesday, 1:00. New Zealand is an exporter of agricultural commodities. So, prices of commodities have a strong impact on the economy and on currency flows. After a jump of 1.1% in January, prices remained flat in February. A small tick up is likely now.
* All times are GMT.
NZD/USD Technical Analysis
Kiwi/$ kicked off the week with a nice move higher above the 0.8190 line (mentioned last week). This course reversed and the battle continued. The pair eventually closed at 0.8178, just under this line.
Technical lines, from top to bottom:
0.8573 was a stubborn line of resistance during August 2011 and remains of high importance. 0.8505 was a peak on the way up during July. A move higher in February 2012 fell short of this line.
The 0.84 line separated ranges in August 2011, and earlier served as support when the kiwi traded higher. While this line was hurt recently, it still serves as a serious cap. 0.8340 was a peak in September and now returns to support. It was a tough line of struggle in February 2012.
0.8280 capped the pair in a stubborn manner during March 2012, and set the pair falling. 0.8240 was a peak in October and also back in May 2011. It proved its strength in January 2012 and also in March 2012 as a strong resistance line.
0.8190 is the next line. It capped the pair in March 2012 and also provided some support in January. The round number of 81 worked as support in February 2012 and also later on.
0.8060 was resistance in October and support beforehand.. It was also tested in January and in March, this time as support and provided to be very strong. The round number of 0.80 managed to cap the pair in November and remains of high importance, especially due to its psychological importance.
Another round number, 0.79, is now stronger resistance after capping a rise at the beginning of 2012. 0.7840 worked as cap for a range and earlier stopped the pair in October. It then became much stronger in December, holding the range. The pair approached in the last days of 2011, but couldn’t really challenge it.
0.7773 was the bottom border of a range at the beginning of 2012, and also in December. 0.77 provided support in December and is now minor support. 0.7637 was a swing low in September and provided its strength in December as a swing low. It is a still strong, after capping a recovery attempt in December.
0.7550 now has a stronger role after working as a very distinct line separating ranges. It had a similar role back in January.
I remain bearish on NZD/USD
With China slowing down and the US economy still looking stable at the moment, the kiwi has room to fall. A lot depends on US figures this week.
Further reading:
- For a broad view of all the week’s major events worldwide, read the USD outlook.
- For EUR/USD, check out the Euro to Dollar forecast.
- For the Japanese yen, read the USD/JPY forecast.
- For GBP/USD (cable), look into the British Pound forecast.
- For the Australian dollar (Aussie), check out the AUD to USD forecast.
- For USD/CAD (loonie), check out the Canadian dollar forecast
- For the Swiss Franc, see the USD/CHF forecast.

