The kiwi was hit and lost some ground. Where will it find a bottom? RBNZ Financial Stability Report is the major event this week. Here’s an outlook for the events in New Zealand, and an updated technical analysis for NZD/USD
The New Zealand job market increased less than predicted in the fourth quarter of 2011 rising 0.4% after 0.2% increase in the third quarter while unemployment rate increased to 6.7% from 6.4% in the third quarter. Will the first quarter results improve?
Updates: Taking its cue from the Australian dollar, the kiwi skidded downwards, dropping below the pivotal 80.0 level. USD/NZD was trading at 79.56, and is trading at levels not seen since January. The RBNZ Financial Stability Report, a semi-annual report released by the central bank, will be published on Tuesday. USD/NZD continues to slide, falling as low as 0.7880. The pair edged upwards, and was trading just above the 0.79 level, at 0.7906. The kiwi’s slump continues, as NZD/USD was trading at 0.7856. The pair has not dropped to this level since January. The Business NZ Manufacturing Index will be released later on Wednesday. Wednesday’s releases were major disappointments. The Business NZ Manufacturing Index dropped to 48.5 points. It was the first time that the index dropped below the 50.0 level this year, indicating a contraction in the manufacturing sector. HPI also sagged, posting a reading of -0.3%. This was a sharp drop from the April reading of 1.9%. So far, the kiwi has shrugged off the bad news, and is moving upwards. NZD/USD was trading at 0.7881.
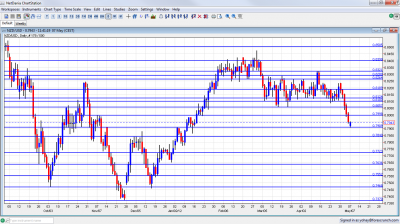
NZD/USD daily chart with support and resistance lines on it. Click to enlarge:
- RBNZ Financial Stability Report: Tuesday, 21:00. On its last Financial Stability Report in November 2011 the RBNZ raised concerns over bank funding risk which resulted in an increase of the core funding ratio. The sharp deterioration was caused by the global slowdown and lack of foreign investments. However, New Zealand banks raise a substantial portion of their funding from foreign capital markets which ay be a further downside risk.
- REINZ HPI: Wednesday.New Zealand house prices, edged up 1.9% in March, amid a surge in home sales. This increase indicates improvement in the housing sector. The previous reading showed a 0.8% gain.
- Business NZ Manufacturing Index: Wednesday, 22:30. New Zealand Manufacturing Activity Slows In March but remained above the 50 point line suggesting expansion. March reading reached 54.5 following57.7 in February. However these positive results contribute to the overall GDP growth.
- FPI: Thursday, 22:45.New Zealand’s food price index dropped 1.0% in March compared to 0.6% gain in February amid a decline in fruit and vegetable prices. On a yearly base food prices increased 0.2%.
* All times are GMT.
NZD/USD Technical Analysis
Kiwi/$ tried to break above the 0.8190 line (mentioned last week) but after this line was lost, it lost a lot of ground and finally closed under 0.80 – a big weekly loss.
Technical lines, from top to bottom:
We start from a lower line this time. The 0.84 line separated ranges in August 2011, and earlier served as support when the kiwi traded higher. While this line was hurt recently, it still serves as a serious cap. 0.8320 capped an attempt for a surge in April 2012 and is now of stronger importance.
0.8290 capped the pair in a stubborn manner during March 2012, and set the pair falling. 0.8264 capped the pair as a double top in both March and April 2012 and proved to be quite strong.
0.8190 is the next line, which proved to a strong cap after it was broken. It capped the pair in March 2012 and also provided some support in January. The round number of 0.81 now switches to resistance after proving itself as a cushion at the end of April 2012.
0.8060 was resistance in October and support beforehand.. It was also tested in January and in March, is much weaker now after only temporarily stopping the fall. The round number of 0.80 managed to cap the pair in November and remains of high importance, especially due to its psychological importance.
Another round number, 0.79, is now key support after capping a rise at the beginning of 2012. 0.7840 worked as cap for a range and earlier stopped the pair in October. It then became much stronger in December, holding the range. The pair approached in the last days of 2011, but couldn’t really challenge it.
0.7773 was the bottom border of a range at the beginning of 2012, and also in December. 0.77 provided support in December and is now minor support. 0.7637 was a swing low in September and provided its strength in December as a swing low. It is a still strong, after capping a recovery attempt in December.
0.7550 now has a stronger role after working as a very distinct line separating ranges. It had a similar role back in January. Below, 0.7470 is significant support after working as support at the end of 2011.
The last line for now is 0.7370, which was the trough in December.
I remain neutral on NZD/USD
The weak job figures and the news from Europe certainly weigh on the kiwi. Nevertheless, some kind of correction can be expected after this downfall.
Further reading:
- For a broad view of all the week’s major events worldwide, read the USD outlook.
- For EUR/USD, check out the Euro to Dollar forecast.
- For the Japanese yen, read the USD/JPY forecast.
- For GBP/USD (cable), look into the British Pound forecast.
- For the Australian dollar (Aussie), check out the AUD to USD forecast.
- For USD/CAD (loonie), check out the Canadian dollar forecast
- For the Swiss Franc, see the USD/CHF forecast.
