The New Zealand dollar remained in range in the aftermath of the roller coaster . Quarterly PPI figures are the highlights of this week. Here is an outlook for the events moving the kiwi, and an updated technical analysis for NZD/USD.
After the excellent jobs report seen in the previous week, a disappointment was printed in the retail sales report. The volume of sales rose by only 0.3% and core sales disappointed with a drop. Inflation figures now are important for the next decisions of the RBNZ.
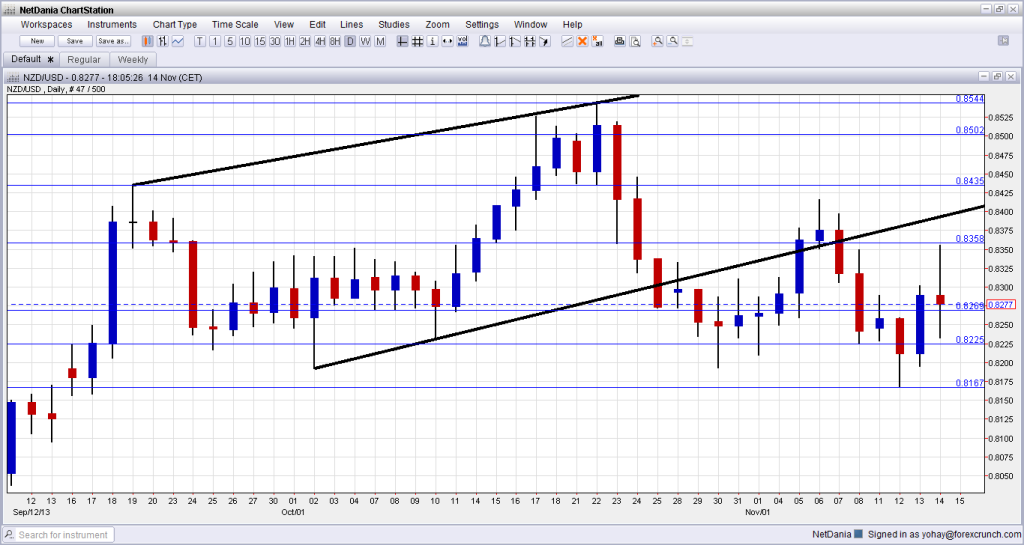
[do action=”autoupdate” tag=”NZDUSDUpdate”/]NZD/USD daily chart with support and resistance lines on it. Click to enlarge:
- PPI: Tuesday, 21:45. The producer price index is published in New Zealand only once per quarter, thus making the market impact stronger. As the Reserve Bank of New Zealand stated that 2014 will likely see a rate hike, the moves in prices will help determine the timing. In Q2, PPI Input rose by 0.6%, exactly as expected. This is the main figure that measures prices that manufacturers received. PPI Output rose by 1%.
- Credit Card Spending: Thursday, 2:00. Changes in consumers’ mood can be seen in usage of credit cards, which are in wide use in New Zealand. The year on year growth that was reported in September stood on 5.2%, lower than 6.6% seen in August. A similar rise is expected now.
- Visitor Arrivals: Thursday, 21:45. New Zealand enjoys a strong tourism sector, so arrivals from overseas have an impact on the wider economy and on the currency. A drop of 1% was seen in September. A rise is now likely in October.
* All times are GMT.
NZD/USD Technical Analysis
NZD/$ dropped early in the week and found support just above the 0.8160 line mentioned last week. It then recovered and tested resistance at 0.8360 before sliding. All in all, it was a good week for technical trading.
Technical lines, from top to bottom:
The year-to-date high of 0.8676 is the top line. It stands in the distance. Below, the peak in April, at 0.8585 is the next line of resistance.
October’s high of 0.8544 is close by. At the moment, it is only weak resistance. The round number of 0.85 is also watched.
0.8435 was the peak in September – a peak that triggered a big downfall. After it was broken again, the line switched to support. It is a clear separator.
0.8360 worked in both directions at the beginning of the year: in March as resistance and in April as support. Also more recently, it worked as yet another clear separating line. Below, 0.8270 provided some support during October, and it also worked as resistance in March.
0.8225 was an important line in previous years, and also worked as support recently. 0.8160 capped the pair in August and worked as support in March. The round number of 0.81 worked as resistance in July.
Lower, 0.8050 was a peak back in June and works as support before the very round number of 0.80.
Broken uptrend channel
Since September, NZD/USD traded in an upwards channel, with uptrend resistance having a clearer role than support. As the chart shows, NZD/USD broke below this line. Another attempt to break back didn’t last too long.
I am bullish on NZD/USD
Despite the weak retail sales numbers, the New Zealand economy is doing quite well and the central bank is quite hawkish – different from quite a few of its peers. With ongoing flows into the country, we could see the kiwi continue rise.
Further reading:
- For a broad view of all the week’s major events worldwide, read the USD outlook.
- For EUR/USD, check out the Euro to Dollar forecast.
- For the Japanese yen, read the USD/JPY forecast.
- For GBP/USD (cable), look into the British Pound forecast.
- For the Australian dollar (Aussie), check out the AUD to USD forecast.
- For USD/CAD (loonie), check out the Canadian dollar forecast.

