EUR/USD just continued falling and falling, nearing levels last seen almost 12 years ago. Some inflation figures, a German survey and another TLTRO round are the main events. Here is an outlook for the highlights of this week and an updated technical analysis for EUR/USD.
There were various factors weighing on EUR/USD. The ECB began its QE program as planned, Greece returned to the headlines and the dollar kept storming forward. The implementation of QE seems to be swift, as the central bank finds no shortage of bonds to buy. Some profit taking and weak US retail sales helped the pair stabilize, but many suspect this is only a pause on the way down to parity.
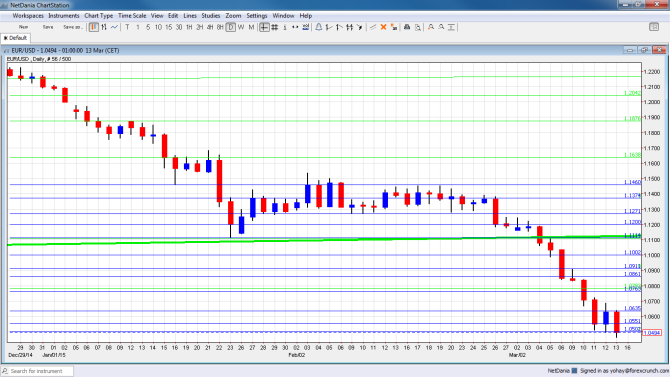
[do action=”autoupdate” tag=”EURUSDUpdate”/]EUR/USD daily chart with support and resistance lines on it. Click to enlarge:
- Bundesbank Monthly Report: Monday. The German central bank publishes a monthly report detailing the situation of the local economy and the outlook. Germany seems to be doing well with strong growth and falling unemployment, but this did not stop the euro on its way down.
- Mario Draghi talks: Monday, 18:45. The president of the ECB weighed on the euro in a conference even though he didn’t say anything new. He has another chance to rock markets, speaking in Frankfurt. However, the topic is the finance industry, so he might decide to refrain from monetary policy.
- German ZEW Economic Sentiment: Tuesday, 10:00. This 275 strong survey rose once again in February, but slightly less than expected. Will we see confidence eroding after 4 consecutive climbs? The early indicator for March carries quite a lot of weight. The all European figure stood on a similar 52.7 points.
- Final CPI: Tuesday, 10:00. The initial data for February showed less deflation than expected, at -0.3%. The stabilization in oil prices helped. However, core CPI remained at 0.6%. Both numbers will likely be confirmed. The ECB made it clear that its upbeat forecasts are based on full implementation of its programs: QE will not stop so fast.
- Employment Change: Tuesday, 10:00. The old continent saw a gain of 0.2% in total employment during the third quarter. Another gain is likely for the fourth one. Note that this is lagging data in comparison to the monthly unemployment rate, which has ticked down to 11.2%.
- Trade Balance: Wednesday, 10:00 .The euro area enjoys a surplus in its balance, a fact that has kept the euro bid during long periods of time. December saw +23.3 billion, and we could now read a slightly lower number.
- ECB Economic Bulletin: Thursday, 9:00. This detailed economic report is now released only two weeks after the rate decision. We have seen a determined Draghi on March 5th. This eventually pushed the euro below 1.10. We will now see why the central bank is determined to carry on with QE.
- Targeted LTRO: Thursday, 10:15. The ECB has already made two targeted loan installments, resulting in 82.6 billion in September and nearly 130 million in December. More money into the system should help the real economy, according to the central bank. For the euro, more loans mean potentially less QE, and this could be positive. Less loans could weigh on the currency.
- German PPI: Friday, 7:00. Producer prices dropped by 0.6% in January, after 0.7% in December. For February, we could see a more stable outcome. This adds to the inflation picture.
- Current Account: Friday, 9:00. Hand in hand with trade balance, the wider measure also shows a significant surplus, even though it squeezed in December to 17.8 billion. A similar figure is likely now.
* All times are GMT
EUR/USD Technical Analysis
Euro/dollar started off the week with an attempt to recover.
Live chart of EUR/USD: [do action=”tradingviews” pair=”EURUSD” interval=”60″/]
Technical lines from top to bottom:
We start from lower ground this time. 1.1373 was the low line seen in November 2003 and proved to work as resistance and support lately. Below the initial low point of 1.1313 we have 1.1270, which provided support twice in February 2015.
The round number of 1.12 was the pivotal line in the range. It is followed by the fresh low of 1.1113 which is nearly 0.90 on USD/EUR.
The next line is the round 1.10. It was minor support back in October 1999: 1.0910. It was resistance back then. This is followed by 1.0860, which is where the pair paused in March 2015.
It is followed by 1.0760, which was the low point in both July and August 2003. We can mark 1.0635 as a pivotal high line, after providing some resistance in March 2015. Another minor line is 1.0550, for a role as support in the same period of time.
The very round level of 1.05 served as support during 2003 and the dip to 1.0494 seen in March 2015 is so far only a false break: the line holds.
We have some support at 1.0360: this was the low point in January 2003. Further down, 1.0170 worked as resistance back in November 2012. It is close to the swing high of 1.0208 seen in July of that year.
Below this point we have the very obvious level of 1 – EUR/USD parity, which is already eyed by more analysts.
I am bearish on EUR/USD
Sentiment is very strong against EUR/USD from both sides: QE is proving to be a success story so far and Draghi reiterated that the good forecasts depend on implementation: no stop in QE. EUR/USD is already not so far away, and it seems that the euro-zone economies will love it.
From the other side of the Atlantic we will probably get a removal of forward guidance from the Fed. Yellen is set to dust away the doubts that came from weak figures such as retail sales. The solid core inflation and robust jobs reports pave the way forward for a hike in June.
In our latest podcast, we discuss QE: Who got it right, Krugman or the Gold bugs?
Follow us on the iTunes page
Further reading:
- For a broad view of all the week’s major events worldwide, read the USD outlook.
- For the Japanese yen, read the USD/JPY forecast.
- For GBP/USD (cable), look into the British Pound forecast.
- For the Australian dollar (Aussie), check out the AUD to USD forecast.
- USD/CAD (loonie), check out the Canadian dollar forecast
- For the kiwi, see the NZDUSD forecast.
