USD/CAD reversed directions last week, dropping 110 points. The pair closed the week at 1.3015. This week’s key event is GDP. Here is an outlook on the major market-movers and an updated technical analysis for USD/CAD.
US indicators were mixed last week, as housing data was solid but durable goods orders was weak. GDP posted a lukewarm gain of 0.8%. Fed Chair Yellen kept the door open to a June rate hike and this boosted the dollar. In Canada, the BoC kept rates at 0.50%.
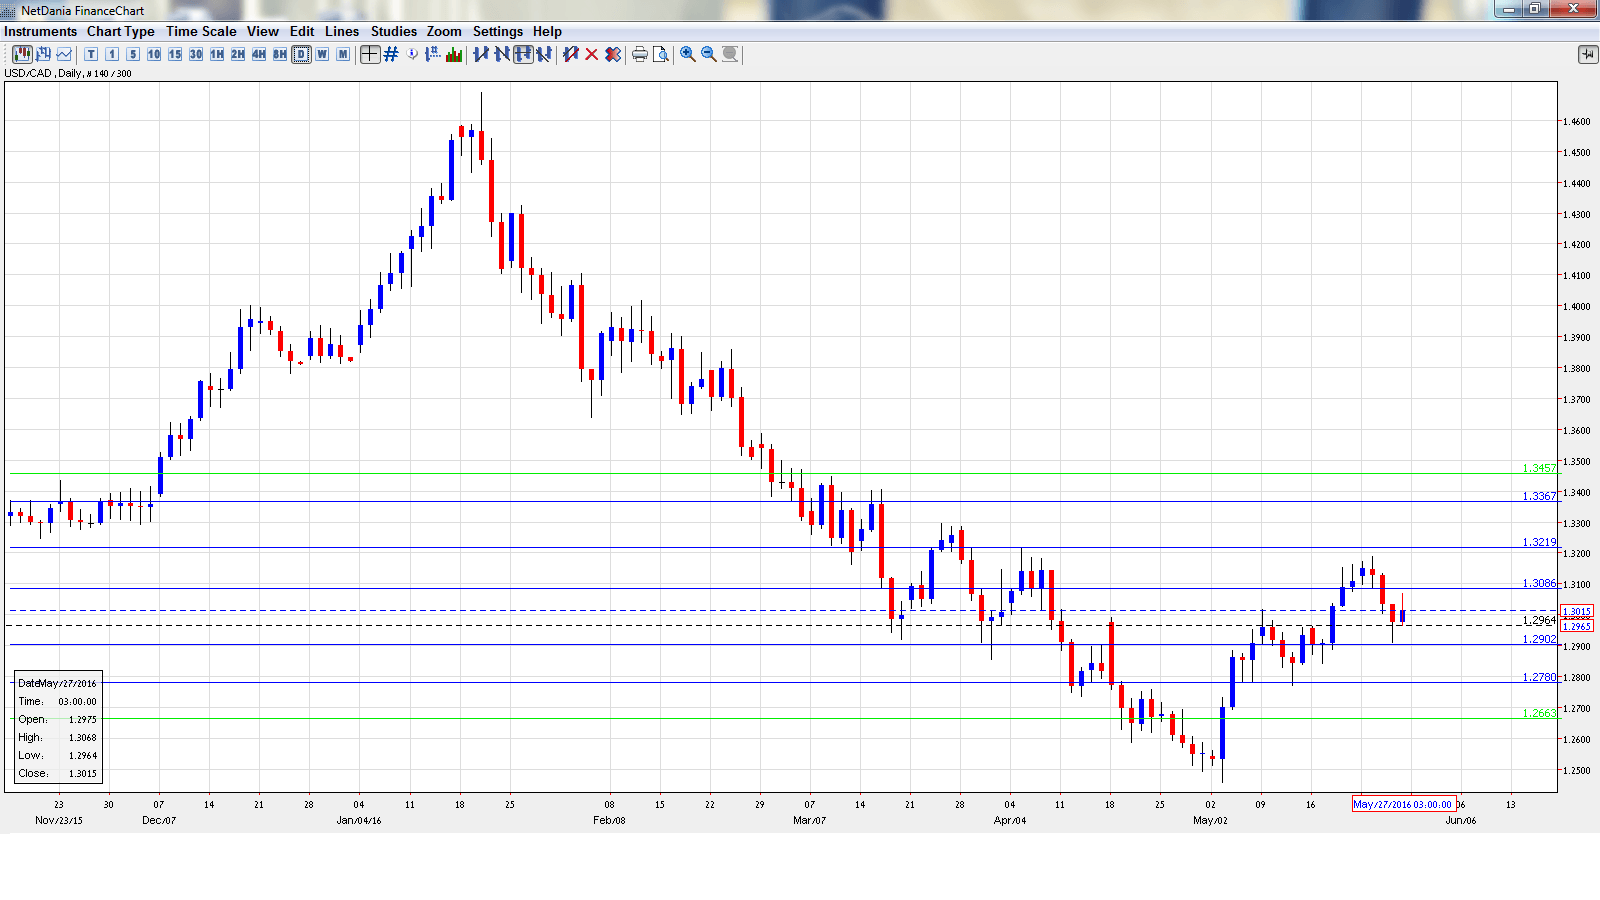
[do action=”autoupdate” tag=”USDCADUpdate”/]USD/CAD daily graph with support and resistance lines on it. Click to enlarge:
- Current Account: Monday, 12:30. Current Account is closely linked to the demand for Canadian dollars. The current account deficit narrowed to C$15.4 billion in Q4, compared to the estimate of a deficit of C$16.8 billion. The markets are expecting the deficit to widen in Q1, with an estimate of C$17.4 billion.
- RMPI: Monday, 12:30. This indicator measures inflation in the manufacturing sector. The index rebounded in March, posting a strong gain of 4.5%, above the estimate of 3.9%. This marked the strongest gain since February 2015. Another gain is expected in the April report, with an estimate of 2.2%.
- GDP: Tuesday, 12:30. GDP is one of the most important economic indicators, and an unexpected reading can have a sharp impact on the movement of USD/CAD. Canadian GDP is released every month. The economy declined 0.1% in March, its first decline since November 2015. The estimate for April is a flat 0.0%.
- RBC Manufacturing PMI: Wednesday, 13:30. This PMI has posted two straight readings above the 50-level, which is indicative of expansion in the manufacturing sector. Will we see another positive release in the April report?
- Trade Balance: Friday, 12:30. Canada’s trade deficit widened to C$3.4 billion in March, well above the estimate of C$1.2 billion. The deficit for April is forecast at $C2.6 billion.
- Labor Productivity: Friday, 12:30. This indicator is released on a quarterly basis. The indicator has posted a small gain of 0.1% in the past two quarters, at 0.1%. Will we see an improvement in the Q2 report?
USD/CAD Technical Analysis
USD/CAD opened the week at 1.3124 and touched a high of 1.3188. The pair then reversed directions and dropped to a low of 1.2910, as support held firm at 1.2900 (discussed last week). USD/CAD closed the week at 1.3015.
Live chart of USD/CAD: [do action=”tradingviews” pair=”USDCAD” interval=”60″/]
Technical lines, from top to bottom
We begin with resistance at 1.3457.
1.3367 has provided resistance since mid-March.
1.3219 was a cap in April.
1.3081 has switched to a resistance role following strong losses by USD/CAD. It is a weak line.
1.2990 has held firm since mid-April
1.2900 is providing support. This line was under strong pressure last week but held firm.
1.2780 is next.
1.2663 is the final support line for now.
I am bullish on USD/CAD
In the US, a June rate hike isn’t likely, but a move in July is certainly an option. Canada’s economy has not kept up with the US, and monetary divergence continues to favor the US dollar.
In our latest podcast we talk stocks, oil and preview the big week.
Follow us on Sticher or on iTunes
Further reading:
- For a broad view of all the week’s major events worldwide, read the USD outlook.
- For EUR/USD, check out the Euro to Dollar forecast.
- For the Japanese yen, read the USD/JPY forecast.
- For GBP/USD (cable), look into the British Pound forecast.
- For the Australian dollar (Aussie), check out the AUD to USD forecast.
- For the kiwi, see the NZDUSD forecast.
