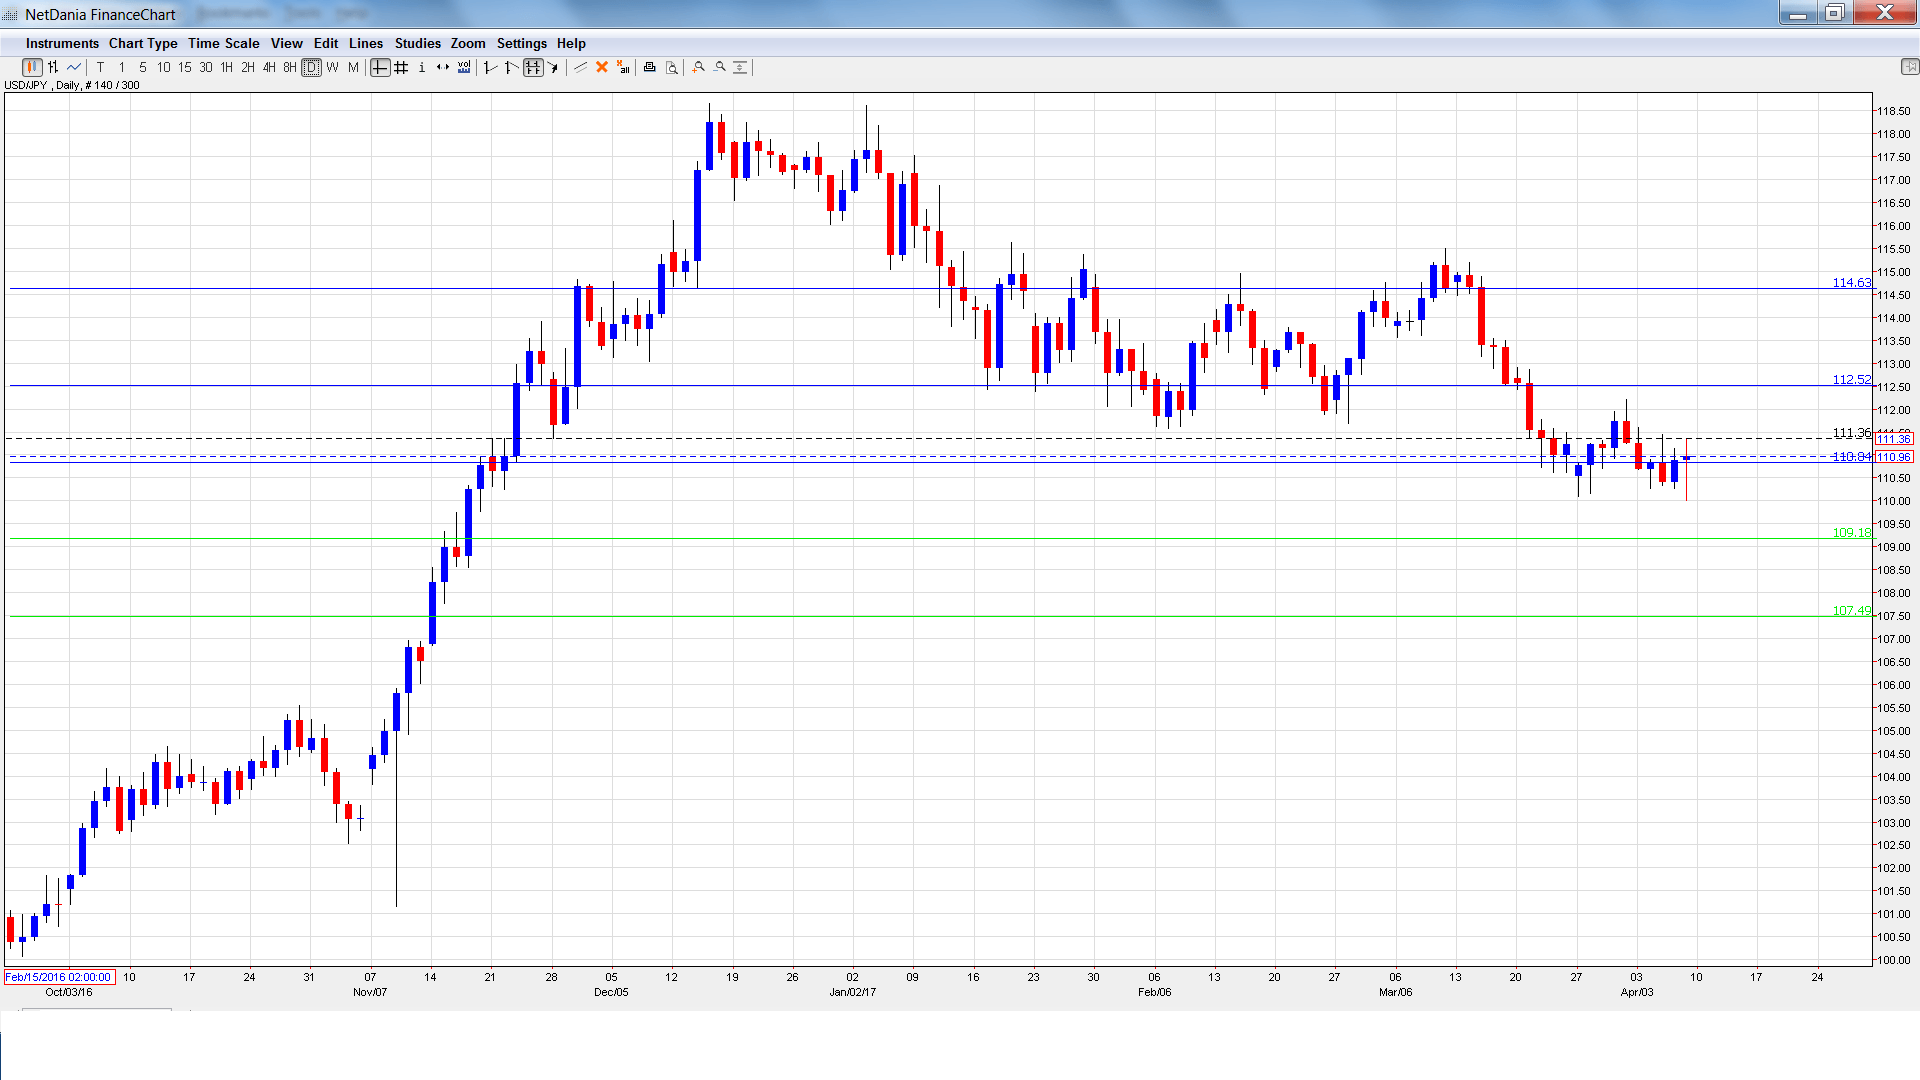
USD/JPY closed the week almost unchanged, although the pair dropped to the 110 level during the week. USD/JPY closed the week at 110.96. There are seven releases this week. Here is an outlook for the highlights of this week and an updated technical analysis for USD/JPY.
In the US, Non-Farm Payrolls report disappointed with only 98K jobs gained, but wage growth was steady and unemployment claims dropped sharply. The Fed minutes were slightly hawkish, leaving room for additional hikes. In Japan, the Tankan indices both improved in the first quarter.
[do action=”autoupdate” tag=”USDJPYUpdate”/]USD/JPY graph with support and resistance lines on it. Click to enlarge:
- Current Account: Sunday, 23:50. Japan’s current account surplus dropped for a third straight month, coming in at JPY 1.26 trillion in January. The indicator is expected to rebound in February, with an estimate of JPY 1.79 trillion.
- Economy Watchers Sentiment: Monday, 5:00. In February, the indicator dropped to 48.6, short of the forecast of 49.9 points. The estimate for March stands at 49.8 points.
- Preliminary Machine Tool Orders: Tuesday, 6:00. Japan’s manufacturing sector has been improving. This indicator has posted three straight gains after a long stretch of declines, posting a strong gain of 9.1% in March.
- Bank Lending: Tuesday, 23:50. Credit levels are closely monitored, as they are linked to consumer spending levels. In February, the indicator climbed 2.8%, edging above the forecast of 2.7%. The upward trend is expected to continue in March, with an estimate of 2.9%.
- 30-y Bond Auction: Wednesday, 3:45. The 30-year yield dropped to 0.82% in March, down from 0.91% in February.
- M2 Money Stock: Wednesday, 23:50. The indicator has been slowly moving higher, and reached 4.2% in February, matching the forecast. No change is expected in the March release.
- Revised Industrial Production: Friday, 4:30. This manufacturing indicator declined 0.4% in January, its first decline in six months. Still, this beat the estimate of -0.8%. The markets are expecting a strong turnaround in February, with an estimate of +2.0%.
USD/JPY opened the week at 111.26. The pair quickly climbed to a high of 111.59, as resistance held firm at 112.53 (discussed last week). The pair then reversed directions and dropped to a low of 110.00 late in the week. The pair couldn’t consolidate at this level and closed at 110.96.
Live chart of USD/JPY:
Technical lines from top to bottom:
We start with resistance at 114.63. This line was a cushion in December 2016 and January 2017.
112.53 is next.
110.83 has weakened in support. It could see action early in the week.
109.18 is next. This line marked the start of a rally in September 2008 which saw USD/JPY drop close to the 0.87 level.
107.49 is the final support line for now.
I am bullish on USD/JPY
The US economy continues to expand and the Federal Reserve is likely to raise rates another quarter-point in June. Despite the unpredictability of Donald Trump, sentiment continues to favor the US dollar.
Our latest podcast is titled Brexit Bad and “Clean Coal”
Follow us on Sticher or iTunes
Safe trading!
Further reading:
- For a broad view of all the week’s major events worldwide, read the USD outlook.
- For EUR/USD, check out the Euro to Dollar forecast.
- For the Japanese yen, read the USD/JPY forecast.
- For GBP/USD (cable), look into the British Pound forecast.
- For the Canadian dollar (loonie), check out the Canadian dollar forecast.
- For the kiwi, see the NZD/USD forecast.

