EUR/USD corrected its previous gains and dropped within the range. What’s next? The upcoming week features a mix of trade, industrial output, and inflation figures. Here is an outlook for the highlights of this week and an updated technical analysis for EUR/USD.
The ECB continues trying to balance the picture, but sometimes confuses markets. An ECB official said that tapering has not been discussed, sending the euro down. Later, the ECB meeting minutes showed that they had considered removing the easing bias, allowing for a recovery. German retail sales beat expectations while factory orders disappointed. PMIs were mostly positive. In the US, the Fed is also split around the timing of the balance sheet reduction as doubts about the third hike in 2017 persist.
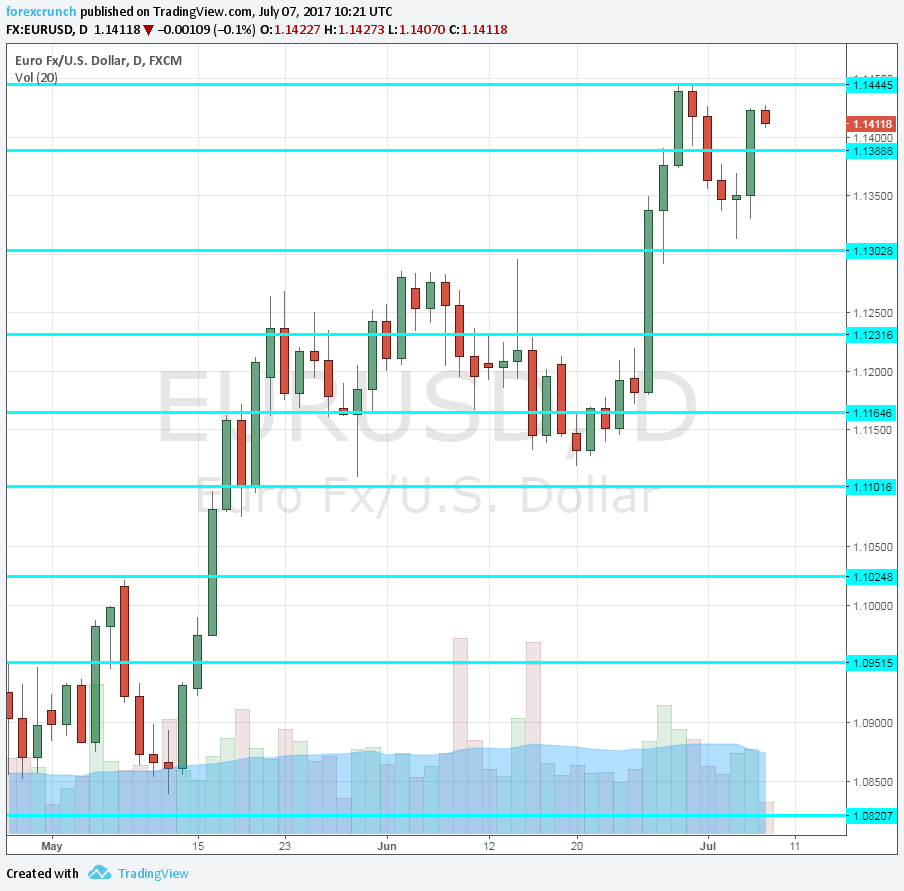
[do action=”autoupdate” tag=”EURUSDUpdate”/]EUR/USD daily chart with support and resistance lines on it. Click to enlarge:
- German Trade Balance: Monday, 6:00. Germany’s huge trade surplus keeps the euro bid. The surplus reached 19.8 billion euros in April. The data for May will likely be similar: 20.3 billion.
- Sentix Investor Confidence: Monday, 8:30. This 2800-strong survey shows growing optimism. The score in June reached 28.4 points, beating expectations for the sixth month in a row. Another to 28.1 points is predicted.
- Industrial Production: Wednesday, 9:00. Industrial output increased by 0.5% in April, as expected. Despite the late release, after the main countries have already published their data, the figure still has an impact. An increase of 1.1% is predicted.
- German Final CPI: Thursday, 6:00. According to the preliminary release, prices rose by 0.2% in Germany in July. The better-than-expected outcome drove the all-European figure higher. The number will likely be confirmed now.
- French Final CPI: Thursday, 6:45. Prices stood still in France in June, as per the preliminary release. This will likely be confirmed.
- Trade Balance: Friday, 9:00. Last month, the Euro-zone trade balance surplus almost totally mirrored the German one, standing at 19.6 billion. Once again, the German number will probably drive the total figure higher: 20.3 billion.
* All times are GMT
EUR/USD Technical Analysis
Euro/dollar began the week on the back foot, sliding towards the 1.13 level (mentioned last week). The pair then recovered.
Technical lines from top to bottom:
1.1620 was a swing high in May 2016. It is followed by the very round number of 1.15.
1.1445 is the June 2017 peak and immediate resistance. 1.1390 is the post breakout low and works as support.
1.13 is the top line seen in November before the collapse. 1.1230 capped the pair in June.
1.1160 was a low point in May, where the pair retreated to after hitting new highs. The round number of 1.11 was a siwng low in late May.
1.1025 was the initial top after the pair breached 1.10 and now works as support. 1.0950 is close by, and the most recent 2017 high.
The swing high of 1.0870 is the swing high in December and remains fierce resistance. 1.0820 was the post-French elections low.
I remain bullish EUR/USD
Once again, the euro took a break from its advance due to pressure from the ECB. Yet reality remains more favorable for the euro in comparison to the dollar: stronger growth, a more favorable political environment and also on the moentary front, some doubt the next hike from the Fed while the tapering ship is about to sail in the euro-zone.
Our latest podcast is titled Where are the wage hikes?
Follow us on Sticher or iTunes
Safe trading!

