- The US consumer inflation report beat estimates.
- Friday’s PPI report confirmed that US inflation was higher than expected.
- Traders will review meeting minutes from the last ECB and Fed policy meetings.
The EUR/USD weekly forecast is slightly bearish, as resilient inflationary pressures in the US will likely keep the dollar strong.
Ups and downs of EUR/USD
The pair had a slightly bearish close, well above the lows hit during the week. This shows that after declining, the pair rose as the week ended. Notably, the dollar strengthened at the start of the week after the US consumer inflation report beat estimates.
–Are you interested to learn more about automated forex trading? Check our detailed guide-
Although there was a poor retail sales report, the Friday PPI report confirmed that US inflation was higher than expected. Meanwhile, the Euro strengthened on hawkish remarks from the ECB’s Francois Villeroy. Francois said the sooner the central bank started cutting rates, the better. This way, they can do it gradually.
Next week’s key events for EUR/USD
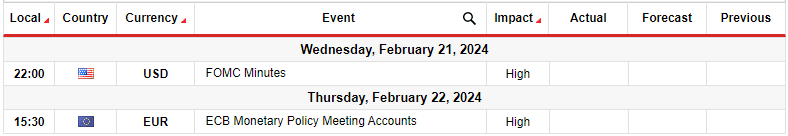
Next week, traders will get a chance to review meeting minutes from the last ECB and Fed policy meetings. These will give clues on what these major central banks might do next. In the last week, markets kept adjusting the outlook for monetary policy in the US and the Eurozone amid incoming data and policymaker remarks.
In the US, upbeat inflation data led to a drop in rate cut expectations. Meanwhile, in the Eurozone, there were mixed signals. ECB President Lagarde was against early cuts. On the other hand, Francois Villeroy said it would be better to start early and cut rates gradually.
EUR/USD weekly technical forecast: Bears pause at 1.0724 support
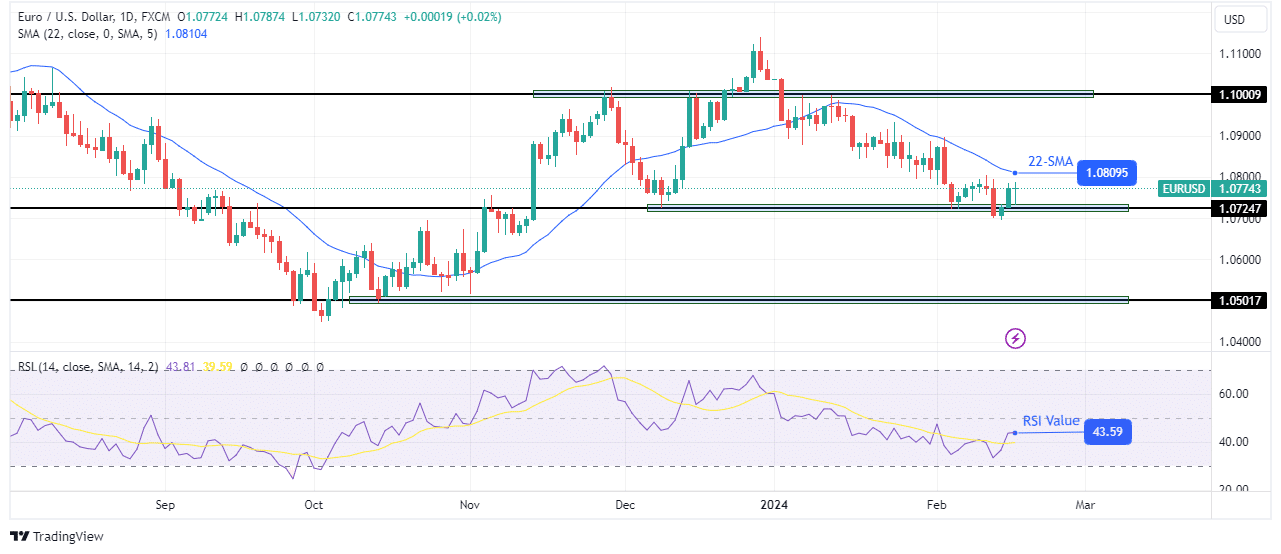
On the technical side, the price has declined and paused at the 1.0724 support level. The bias for EUR/USD on the daily chart is bearish because the price sits below the 22-SMA and the RSI is below 50.
–Are you interested to learn more about forex signals? Check our detailed guide-
The last time the price encountered the 1.0724 support, it reversed, breaking above the SMA to make a higher high. Therefore, there is a chance the bias will shift if bullish momentum strengthens at 1.0724. However, the RSI must go above 50 and the price above the SMA for the current move to reverse. Otherwise, bears will breach the 1.0724 support to retest the 1.0501 support.
Looking to trade forex now? Invest at eToro!
67% of retail investor accounts lose money when trading CFDs with this provider. You should consider whether you can afford to take the high risk of losing your money.
