- The Dollar Index is still bullish; further growth could signal that the USD could appreciate versus its rivals.
- Technically, a temporary drop could be natural after the current upwards movement.
- DXY is traded around strong resistance levels; a bearish pattern may signal a downside movement.
DXY Dollar Index price rallies, and it seems determined to reach new highs after invalidating a deeper drop. The index is strongly bullish ahead of the US inflation data. The bias is bullish, but it remains to see what will really happen as it’s located around strong resistance levels.
–Are you interested to learn more about forex signals? Check our detailed guide-
DXY’s growth helped the USD appreciate its rivals, so the greenback could jump higher if the index reached new highs. The index increased today also because the Euro-zone and the German ZEW Economic Sentiment have worsened than expected.
The US Prelim Nonfarm Productivity increased by 2.3% less versus 3.3%, which is good for the greenback. Tomorrow, the CPI is expected to register a 0.5% in July below the 0.9% in the former reporting period, while the Core CPI could increase by 0.4% in July versus 0.9% growth in June. Also, the PPI, Core PPI, and the Unemployment Claims will be reported on Thursday.
DXY almost reaches a strong resistance zone, so some poor US data could indicate a potential downside movement.
DXY price technical analysis: More bulls to follow
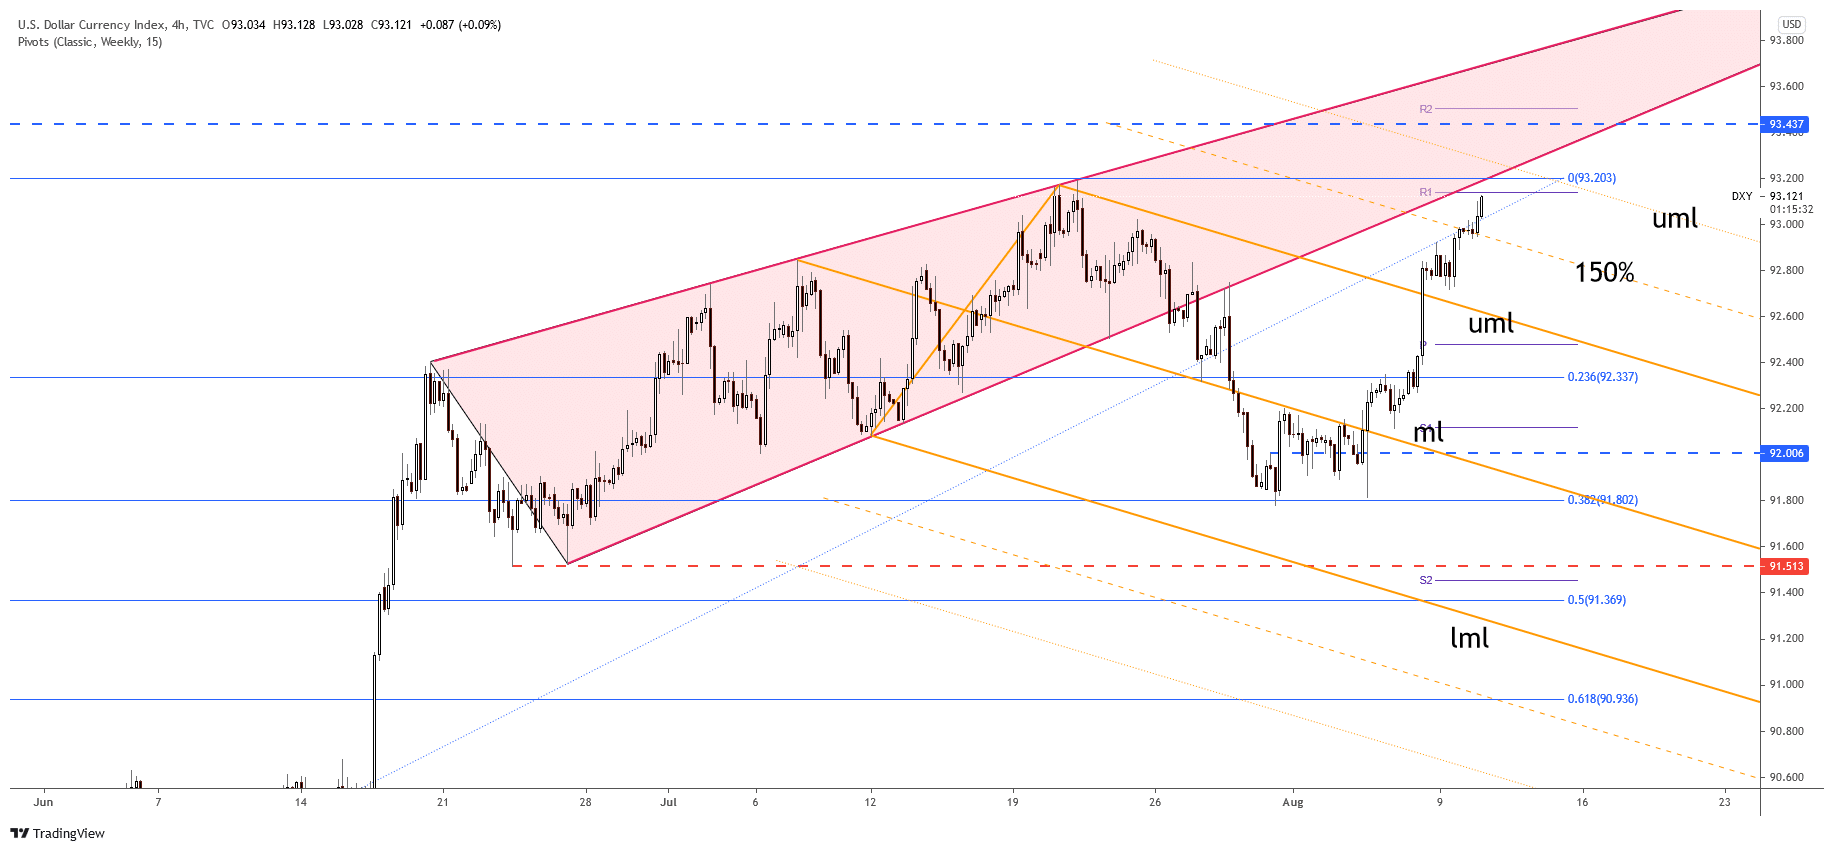
DXY price has increased as much as 93.13, and it was almost to reach the 93.14 weekly R1. A bearish pattern printed here could signal a potential downside movement. The 93.19 higher high is seen as static resistance. Also, the uptrend line represents a dynamic resistance.
The RSI indicates a bearish divergence in the short term, but this is not enough for us. We need a bearish pattern before considering going short on the USD. DXY’s drop signals USD’s depreciation versus its rivals.
–Are you interested to learn more about automated forex trading? Check our detailed guide-
The index has invalidated a further decline after failing to reach and retest the 38.2% retracement level in the last attempt. Technically, a temporary decline is somehow natural after the current swing is higher.
It could return to test and retest the 150% Fibonacci line, which is seen as a dynamic support. DXY could approach and reach the upper median line (UML) as long as it stays above the 150% line.
Looking to trade forex now? Invest at eToro!
67% of retail investor accounts lose money when trading CFDs with this provider. You should consider whether you can afford to take the high risk of losing your money.
