EUR/USD managed to shoot higher and crash back down in a very exciting week with multiple themes at play Industrial output data and other figures will accompany echoes from the ECB. Here is an outlook for the highlights of this week and an updated technical analysis for EUR/USD.
Euro-zone data was relatively upbeat, with better service PMIs, solid retail sales and a lower unemployment rate. In the ECB press conference Draghi tried not to rock the boat. With no big change in forecasts, no front loading and no worries about volatility, the euro reacted positively and rallied higher. In the US, data was not convincing enough and that also supported the rise of the pair. Yet as the Greek crisis escalated and especially as the US enjoyed an excellent gain in jobs that sent the pair significantly lower.
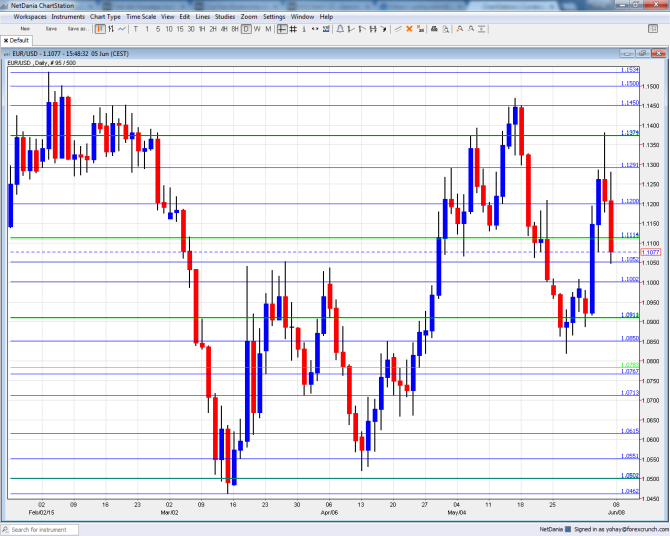
[do action=”autoupdate” tag=”EURUSDUpdate”/]EUR/USD daily chart with support and resistance lines on it. Click to enlarge:
- German Industrial Production: Monday, 6:00. The continent’s locomotive has seen industrial output slide by 0.5% in March, falling short of expectations. A bounce back is likely for April: +0.6%.
- German Trade Balance: Monday, 6:00. The large surplus that Germany commands is one of the reasons keeping the euro bid also in times of trouble. After a positive 19.3 billion in March, a small slide could be seen for April to 18.9 billion.
- Sentix Investor Confidence: Monday, 8:30. This 2800 strong survey dropped to 19.6 points in May, but maintained the high levels it gradually advanced to. A similar number could be seen for June.
- Revised GDP: The preliminary read of euro-zone GDP showed a growth rate of 0.4% in Q1 2015. This was stronger than previous quarters but still left many unconvinced about the sustainability of the recovery. This number will probably be confirmed now.
- French Industrial Production: Wednesday, 6:45. The euro-zone’s second largest economy saw a slide of 0.3% in industrial output back in March, similar to its neighbor. A rise is on the cards now: +0.3%.
- French Final Non-Farm Payrolls: Thursday, 5:30. This broad quarterly measure has been quite stagnant in recent quarters, sliding by 0.1% in Q4. No big changes are expected now, with the lagging data for Q1: another fall of 0.1% is on the cards.
- French CPI: Thursday, 6:45. Inflation has been on the rise in several euro-zone countries. Will France see the same trend? The figure feeds into the final CPI report. After a rise of 0.1% in April, another rise is on the cards for May: +0.3%.
- Industrial Production: Friday, 9:00. While this indicator is released after the German and French publications, it still tends to surprise and move the euro. A slide of 0.3% was seen in March and a recovery could be seen now. Expectations stand on +0.4%.
* All times are GMT
EUR/USD Technical Analysis
Euro/dollar started off the week with a slide once again below the round 1.10 level (mentioned last week), but quickly shot higher. Once that level was broken, the pair enjoyed a swift ride to much higher levels. It stopped around the 1.1373 level and began a downfall, which saw it pause above critical support.
Live chart of EUR/USD: [do action=”tradingviews” pair=”EURUSD” interval=”60″/]
Technical lines from top to bottom:
The round level of 1.15 has a psychological impact and it also worked as support in the past. 1.1450 capped the pair during February’s recovery attempts and also during May.
Below, the historic line of 1.1373 (from November 2003) still has a role as resistance. 1.1290, which was a peak in April and support in February is significant resistance.
1.1190, just below the round number of 1.12, proved its strength as a double top in June 2015. It is followed by a low seen in January of 1.1113 which is nearly 0.90 on USD/EUR.
1.1050 was a high point in March 2015 and now works as important support before the round level of 1.10. This is still a battle line.
The next line was minor support back in October 1999: 1.0910. It was resistance back then and was tested once again in March 2015. This is followed by 1.0815 which worked in both directions.
The next line is 1.0760, which was the low point in both July and August 2003. 1.0715 joins the chart after temporarily capping the pair in April 2015.
1.0660 worked nicely as support in April 2015. 1.0615, which worked in both directions during March 2015 and is better at support.
Another minor line is 1.0550, for a role as support in the same period of time. The very round level of 1.05 served as support during 2003. The lowest level in over 12 years is 1.0462 and this makes it critical support.
Below this point we have the very obvious level of 1 – EUR/USD parity, which is already eyed by more and more analysts
I remain bearish on EUR/USD
The ECB is not accelerating its bond buys and that allowed the euro to rally. Nevertheless, this was certainly exaggerated and the excellent NFP triggered a reality check. The bigger picture is monetary policy divergence. The Fed is likely to hike in September 2015 while the ECB is not expected to stop printing euros until September 2016. That’s a very big difference that could support further losses for the pair.
In this week’s podcast, we explain why EUR rallied on Draghi, what’s next, discuss oil and gas, run through the Plus500 story and preview next week’s events.
Further reading:
- For a broad view of all the week’s major events worldwide, read the USD outlook.
- For the Japanese yen, read the USD/JPY forecast.
- For GBP/USD (cable), look into the British Pound forecast.
- For the Australian dollar (Aussie), check out the AUD to USD forecast.
- USD/CAD (loonie), check out the Canadian dollar forecast
- For the kiwi, see the NZDUSD forecast.
