GBP/USD lost 130 points last week, closing at 1.2165. There are 8 events this week. Here is an outlook for the highlights of this week and an updated technical analysis for GBP/USD.
In the US, a sparking jobs report has virtually ensured a rate hike coming next week. Still, wage growth disappointed, falling short of the forecast. In the UK, Manufacturing Production dropped sharply and missed the estimate.
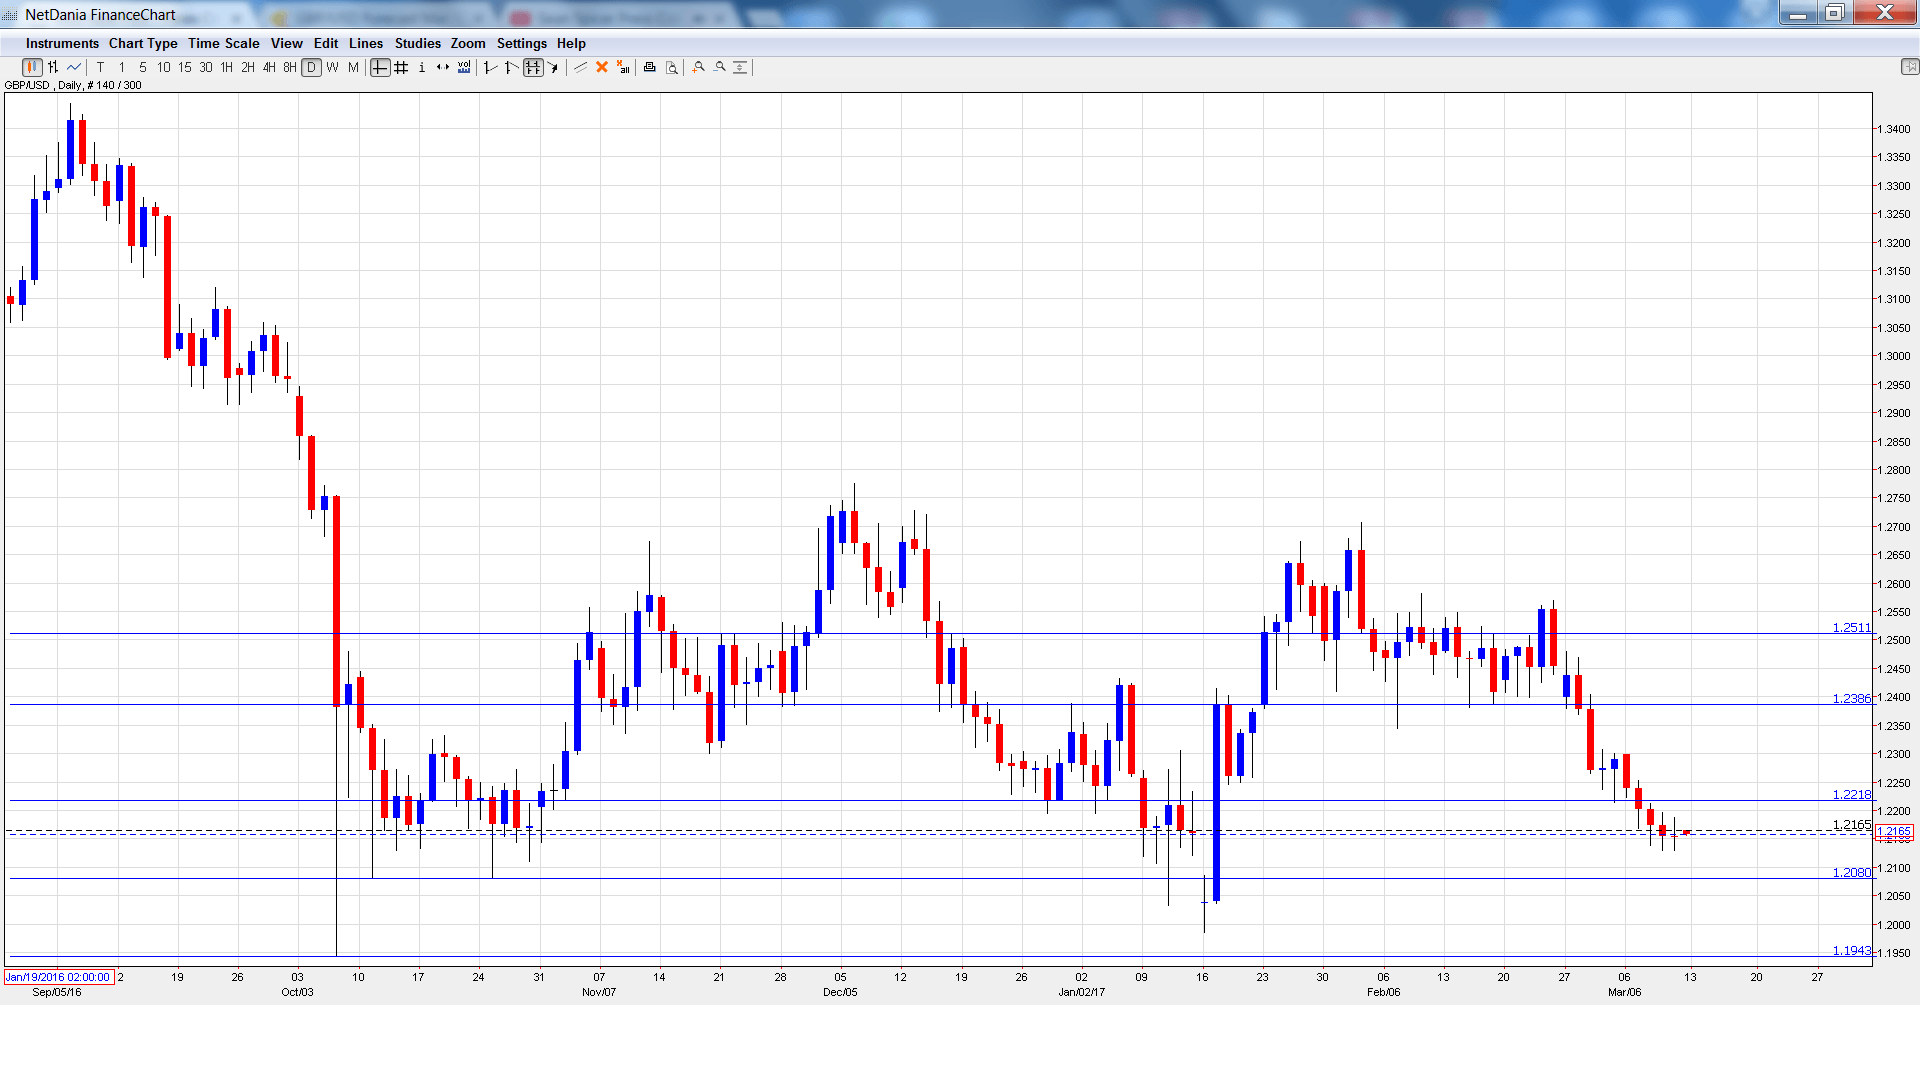
[do action=”autoupdate” tag=”GBPUSDUpdate”/]GBP/USD graph with support and resistance lines on it. Click to enlarge:
- 10-year Bond Auction: Tuesday, Tentative. The 10-year bond dipped to 1.18% in February, down from 1.45% a month earlier.
- CB Leading Index: Tuesday, 13:30. The indicator has been stagnant, posting two straight readings at 0.0%. Will we see some movement in the January report?
- Average Earnings Index: Wednesday, 9:30. Wage growth dipped in December to 2.6%. The downward trend is expected to continue in January, with an estimate of 2.4%.
- Claimant Count Change: Wednesday, 9:30. The indicator sparkled in January, as unemployment rolls shrunk by 42.24 thousand. This was much stronger than expected. The estimate for February stands at +3.2 thousand. The UK unemployment rate is expected to remain at 4.8%.
- Official Bank Rate: Thursday, 12:00. The BoE is expected to maintain rates at 0.25%. The MPC will release the vote breakdown for the February rate decision, when the bank held rates. The markets are predicting that the vote for that decision was a unanimous 9-0 vote.
- Monetary Policy Summary: Thursday, 12:00. This summary is released on a monthly basis. The report contains discusses economic conditions and could provide clues about the BoE’s future monetary policy.
- Asset Purchase Facility: Thursday, 12:00. The BoE’s asset-purchase program is expected to remain at 435 billion pounds. The voting breakdown for the February decision (which remained at 435 billion pounds) is expected to be a unanimous 9-0 vote.
- BoE Quarterly Bulletin: Thursday, 12:00. This report is a minor event, and includes commentary on market developments and market analysis.
* All times are GMT
GBP/USD Technical Analysis
GBP/USD opened the week at 1.2398 and climbed to a high of 1.2399, It was all downhill from there, as the pair dropped to a low of 1.2129, breaking below support at 1.2218 (discussed last week). GBP/USD closed the week at 1.2165.
Live chart of GBP/USD:
Technical lines from top to bottom
We start with resistance at 1.2511.
1.2385 has strengthened in support.
1.2218 has switched to a resistance role following losses by GBP/USD last week.
1.2080 is an immediate support line. It is protecting the symbolic 1.20 level.
1.1943 marked the low point in October 2016.
1.1844 is the final support line for now.
I am bearish on GBP/USD.
The markets have priced in an expected rate hike next week in the US, but the move should still reinvigorate the markets and push up the US dollar. With the Bank of England maintaining a neutral policy regarding rate movement, monetary divergence continues to favor the greenback.
Our latest podcast is titled Fed fever and crashing crude in the Ides of March
Follow us on Sticher or iTunes
“‹
Safe trading!
Further reading:
- For a broad view of all the week’s major events worldwide, read the USD outlook.
- For EUR/USD, check out the Euro to Dollar forecast.
- For the Japanese yen, read the USD/JPY forecast.
- For the kiwi, see the NZD/USD forecast.
- For the Australian dollar (Aussie), check out the AUD to USD forecast.
- For the Canadian dollar (loonie), check out the USD to CAD forecast.
