- The price of gold is moving sideways, so we’ll have to wait for it to escape from this pattern before taking action.
- Technically, the yellow metal is still under some upside pressure after leaving down channel pattern.
- Making a valid breakout through the weekly R1 could activate larger growth.
Gold forecast – The price of gold continues to move sideways, so we’ll have to wait for a fresh trading opportunity before deciding to go long or short. Personally, I believe that the United States inflation data could bring a clear direction.
Technically, XAU/USD was somehow expected to grow after escaping from a continuation pattern.
3 Free Crypto Signals Every Week – Full Technical Analysis
Unfortunately for the yellow metal, the Dollar Index (DXY) is still bullish. DXY’s further growth could signal that XAU/USD may slip lower in the short term.
Tomorrow, the United States Consumer Price Index is expected to register a 0.3% growth, while the Core CPI could rise by 0.2% in September after a 0.1% growth in August. Also, the FOMC Meeting Minutes will be released on Wednesday, this is seen as a high-impact event. Anything could happen tomorrow around these publications.
Moreover, the US is to release its PPI, Core PPI, and the Unemployment Claims on Thursday, while the retail sales figures will be published on Friday. So, the US data could move the price of gold.
Traders should be careful around the US inflation data release and later after the FOMC Meeting Minutes, the volatility will be high, so XAU/USD could register sharp moves.
Looking to try automated forex trading? Read our guide for tips on how to get started.
Gold forecast: XAU/USD Price Technical Analysis – Range Pattern
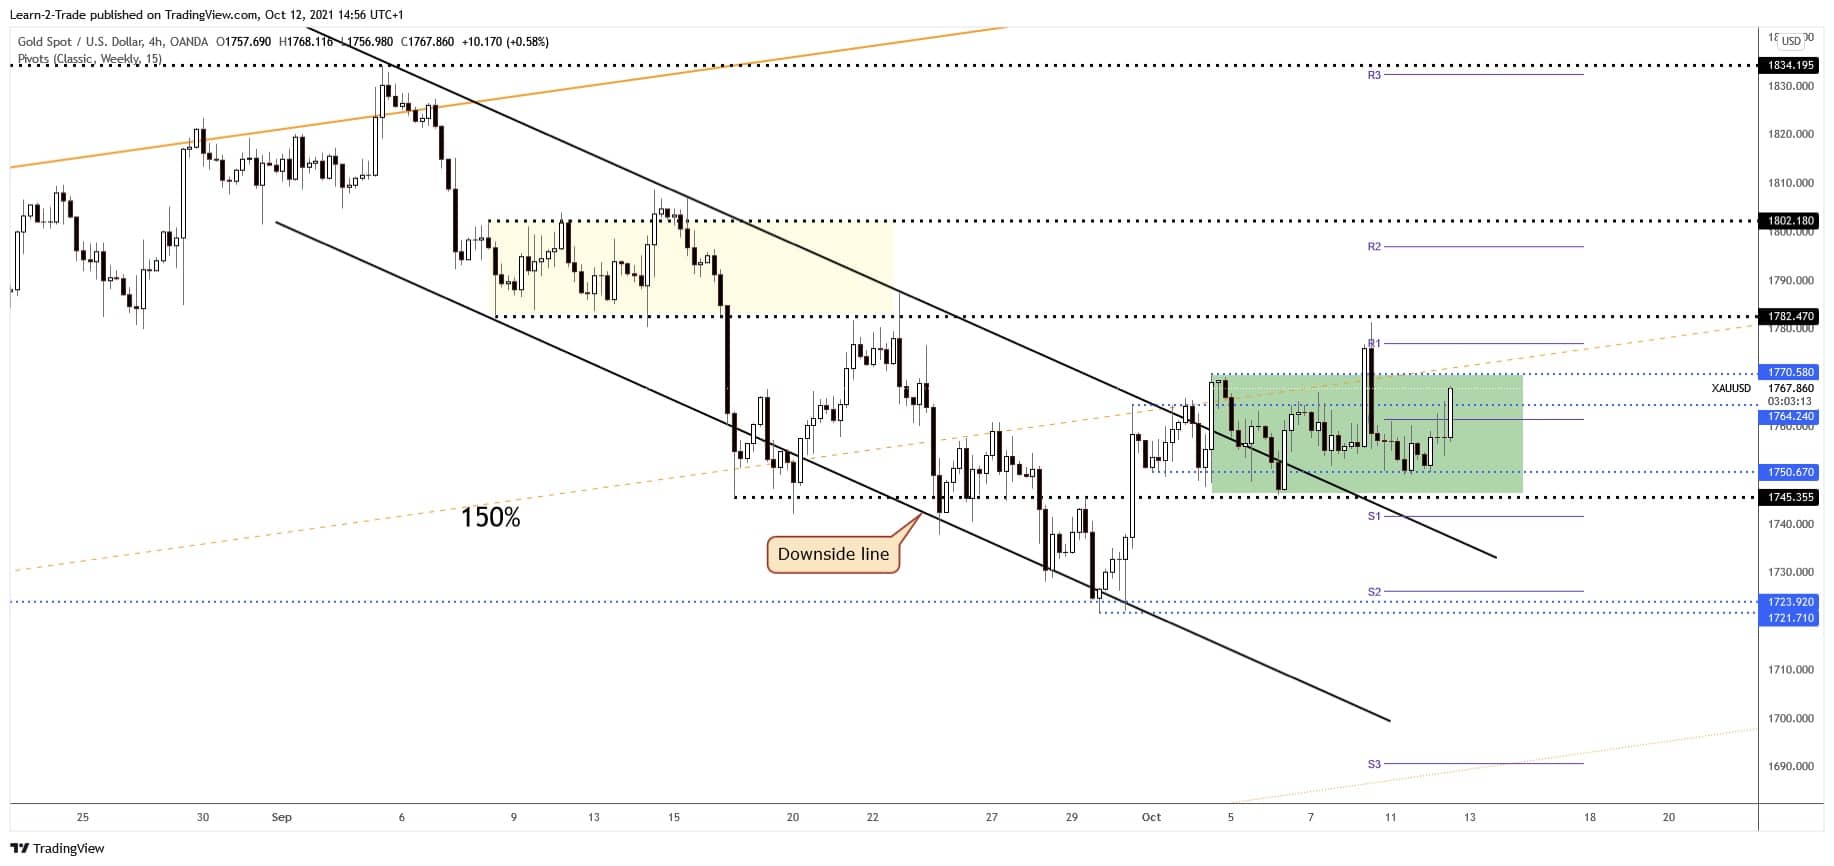
Gold rallied in the last minutes and now it stands at 1,767.97 level far above 1,750.80 today’s low. It has edged higher even if the Dollar Index stays higher. The DXY is into a resistance zone, a downside movement may boost the XAU/USD.
Technically, the price of gold has found support on the 1,750.67 level and now it tries to come back higher towards the 1,770.58 and up to the 150% Fibonacci line. Its failure to approach and reach the 1,745 static support signalled some upside pressure.
From the technical point of view, XAU/USD could develop a broader upwards movement only if it jumps and stabilizes above the 150% Fibonacci line and above the weekly R1 (1,776.99) static resistance.
Looking to trade forex now? Invest at eToro!
67% of retail investor accounts lose money when trading CFDs with this provider. You should consider whether you can afford to take the high risk of losing your money.