The New Zealand dollar moved according to the flute of the RBNZ, but certainly not in the most straightforward manner. The jobs report is the big event of the upcoming week. Here is an analysis of fundamentals and an updated technical analysis for NZD/USD.
The RBNZ cut rates but the kiwi bounced. It was an exaggerated “buy the rumor, sell the fact” response and was especially strange with the promise to do more. Later on, we did see a correction, when the kiwi failed to rise on an excellent retail sales report. Will its behavior return to normal? In the US, data has been mostly positive.
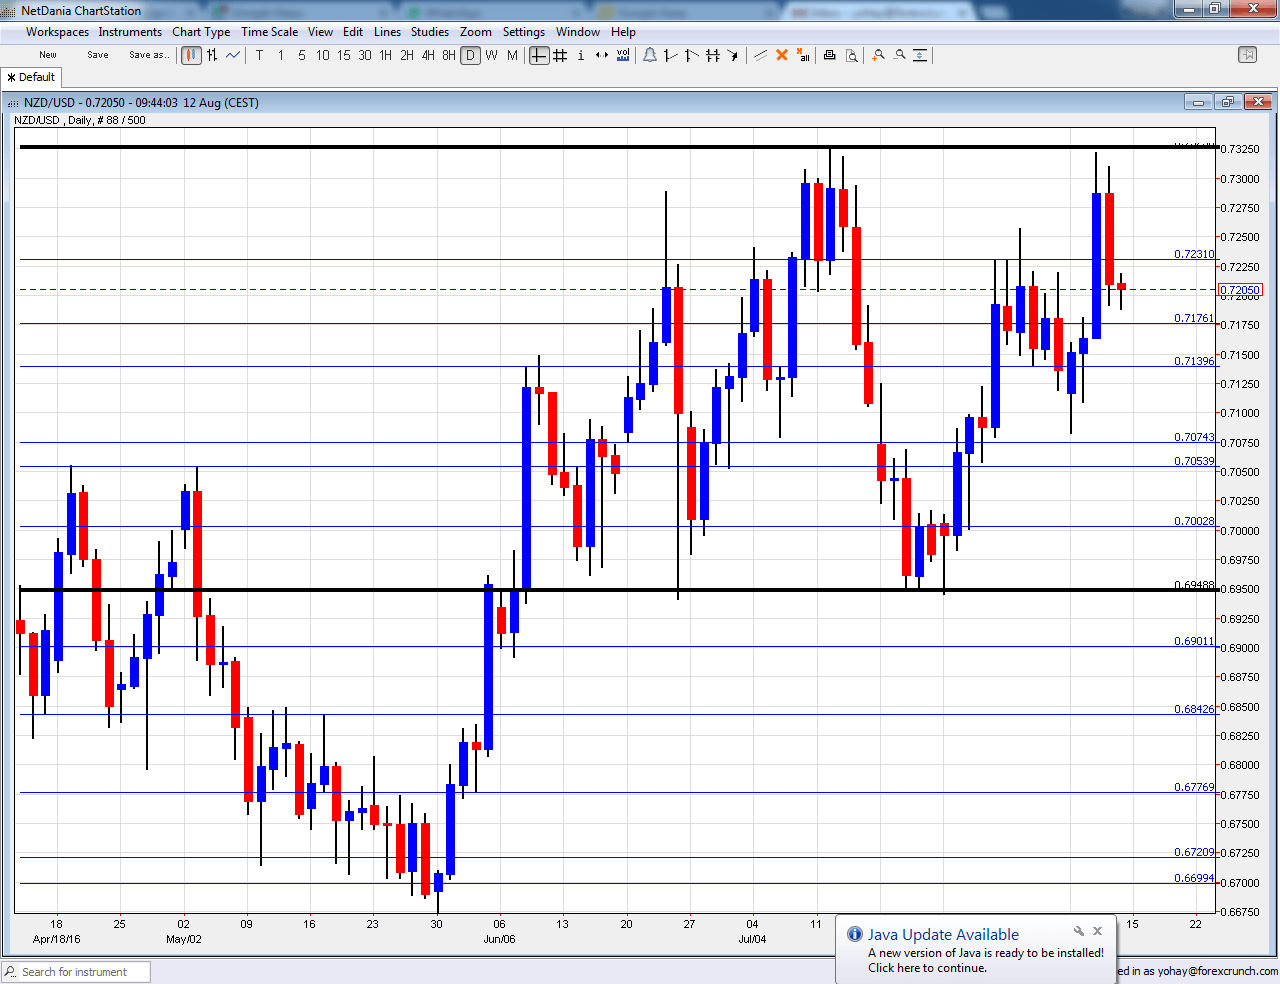
[do action=”autoupdate” tag=”NZDUSDUpdate”/]NZD/USD daily graph with support and resistance lines on it. Click to enlarge:
- GDT Price Index: Tuesday, during the European afternoon. The Global Dairy Trade is basically the price of milk, New Zealand’s main export. Prices surprised with a jump of 6.6%. The bi-weekly indicator could fall now.
- Jobs report: Tuesday, 22:45. Employment figures are released only once per quarter, making every publication a big event. This time, the labor cost index is not released, as this has already happened. However, the employment change and unemployment rate are more important. Employment advanced by 1.2% in Q1, an impressive outcome. The unemployment rate stood at 5.7%. We now get the data for Q2.
- PPI: Tuesday, 22:45. Producer prices are also released only once per quarter but play second fiddle to the Consumer Price Index. PPI Input fell by 1% in Q1 and could bounce now. The less important PPI Output slipped by 0.2%.
- Visitor Arrivals: Thursday, 22:45. Tourism is another significant sector of the New Zealand economy. A drop of 1% was seen in June, mid-winter in the country. A stable figure could be seen now.
- Credit Card Spending: Friday, 3:00. With retail sales published only once per quarter, this gauge of consumer spending is eyed. A y/y rise of 4.1% was seen in June.
NZD/USD Technical Analysis
Kiwi/dollar started the week within the known ranges discussed last week. It reached the highs of 0.7330 before sliding back down.
Technical lines, from top to bottom:
The round number of 0.74 served as resistance and support back in 2015. 0.7305 is the high of 2016 so far.
0.7290 was the pre-Brexit peak and serves as high resistance. The next line is 0.7240 which capped the pair in July 2016.
0.7160 worked as support when the kiwi was trading on the much higher ground in 2014. 0.7050 was the peak in April 2015.
The round level of 0.70 is still important because of its roundness but it isn’t really strong. The low of 0.6940 allowed for a temporary bounce.
The round 0.69 level has switched positions to resistance. 0.6840 capped the pair during May 2016 and tops the range. 0.6720 is the low seen in May 2016 more than once providing the lower bound.
The round level of 0.67 that works nicely as support. Another line worth noting is 0.6640, which capped the pair in November.
I remain bearish on NZD/USD
The RBNZ continues putting pressure on the kiwi dollar and only superb data could balance out the picture.
Our latest podcast is titled Carney King of Governors, Small in Japan
