- US dollar index slides below the key 94.00 mark.
- Rising inflation may help the bulls to retain their strength and test 18-month highs.
- Fed’s tapering and rate hike plan may lend some support to the index.
The US dollar index (DXY) price is trying to consolidate at the bottom of its weekly range around 94.00. In spite of a strong pullback on Wednesday, the index continues to remain under 94.00.
-If you are interested in automated forex trading, check our detailed guide-
In the meantime, yields at the bottom of the curve and at the trailing end have recovered some losses, while short-term gains are still heading towards 18-month highs, especially following recent US inflation data (+ 5.4% y/y in September).
As illustrated by the FOMC minutes published on Wednesday, there is no big surprise regarding the tapering process, which is expected to begin in November and end by the middle of the next decade. A substantial milestone has also been reached, indicating that members generally agree.
The economic docket contains weekly claims followed by the producer price index. Speeches from the Atlanta Fed R.Bostik (voter, center), the Richmond Fed T. Barkin (voter, center), and the New York Fed J. Williams (permanent voter, center) are also included.
With US yields declining, the index fell sharply to 94.00 after hitting new 2021 highs above 94.50 earlier in the week. A positive outlook for debt ceilings and inflation spiked yields to new highs, added to the dollar.
Within the next few months, the dollar will be held up by market adjustments given the prospect of an “early” start to a gradual rate cut, the possibility of a rate hike in 2018, and the possibility of longer-term inflation than originally thought.
US dollar index (DXY) price technical analysis: Selling pressure mounts under 94.00
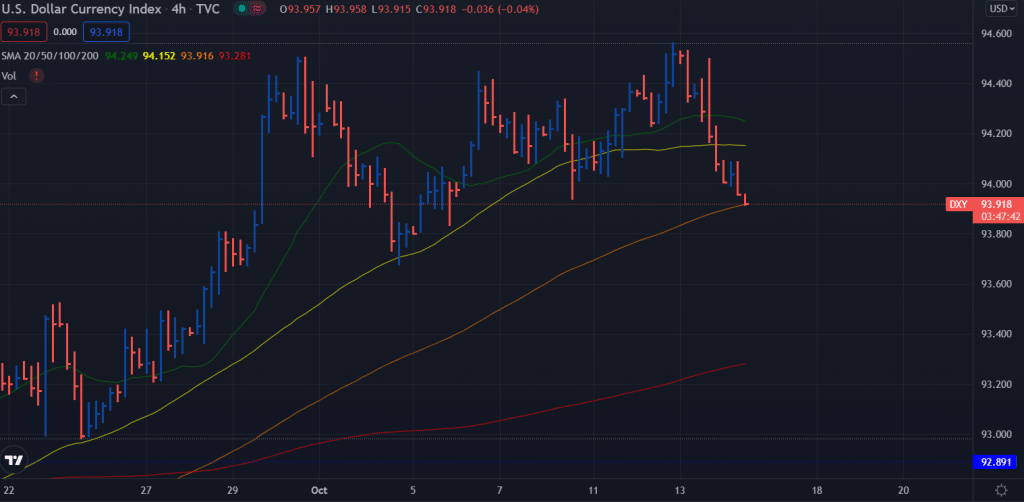
The DXY price remains broadly below the 20-period and 50-period SMAs on the 4-hour chart. The price has just broken below the 94.00 key level. It shows a potential sell-off towards 93.83 ahead of 93.67. However, the price is currently supported by the 100-period SMA and the horizontal support of 93.93.
If you are interested in guaranteed stop-loss forex brokers, check our detailed guide-
On the upside, the index needs to surge beyond the 20-period SMA around 94.25. In that case, we may see a probability to test the multi-month highs and double top at 94.60 area.
Looking to trade forex now? Invest at eToro!
67% of retail investor accounts lose money when trading CFDs with this provider. You should consider whether you can afford to take the high risk of losing your money.
