- Investors are awaiting the publication of US inflation figures.
- The BoC governor stated that the bank’s quick rate increases are beginning to weaken the economy.
- The BoC might need to raise rates higher to combat sticky inflation.
On Tuesday, the USD/CAD outlook deteriorated as investors awaited the publication of US inflation figures and the conclusion of the year’s final Federal Reserve meeting.
-Are you looking for automated trading? Check our detailed guide-
A modest surprise to the downside a month ago sparked a surge of bond purchases and dollar selling on the belief that inflation had peaked. The data due at 1330 GMT will put that presumption to the test, and the Fed’s decision on Wednesday should give policymakers immediate feedback.
The governor of the Bank of Canada stated on Monday that the bank’s quick rate increases are beginning to weaken the economy. However, even if the bank wants to prevent a recession, there is a chance that sticky inflation may necessitate “far higher” rates.
Governor Tiff Macklem stated in a speech to business executives in Vancouver that the tightening had “begun to work” but would take time to spread across the economy.
To combat the 6.9% inflation rate in October, the bank increased interest rates by a record-breaking 400 basis points in just nine months, to 4.25%. This level was previously reached in January 2008.
According to him, the difficulty moving forward is that hiking rates too much run the risk of sending the economy “into an unduly harsh recession.” If they are not raised high enough, price increases will continue to be substantial and feed concerns of sticky inflation.
USD/CAD key events today
Investors will pay attention to US inflation figures which will be released later today. This will cause a lot of volatility as it will guide the Fed’s future policy.
USD/CAD technical outlook: Bears break below 30-SMA after a lower high
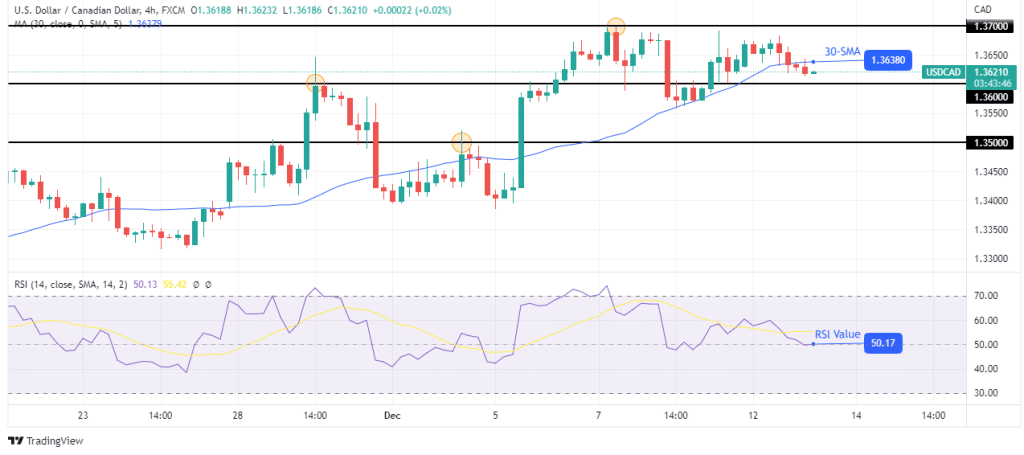
Looking at the chart above, we see the price trading below the 30-SMA. The RSI is trading close to the 50 level, which is a pivotal level. The break below the 30-SMA signifies a shift in sentiment to bearish.
-If you are interested in forex day trading then have a read of our guide to getting started-
The bears are getting closer to the 1.3600 support level. Bears need to break below this level and make a lower low to confirm a trend reversal. If this happens, the price will probably fall to the next support level at 1.3500. However, if bulls return before the price makes lower highs and lower lows, the bullish trend will resume.
Looking to trade forex now? Invest at eToro!
67% of retail investor accounts lose money when trading CFDs with this provider. You should consider whether you can afford to take the high risk of losing your money.
