- USD/CAD pair surges on Tuesday amid weaker oil prices.
- US retail sales data is eyed to find further fresh impetus.
- Fed’s tapering plan is keeping the Greenback supported.
The USD/CAD price managed to break the 1.2600 psychological resistance. The pair is up 0.35% at the time of writing on Tuesday.
Monday’s trading session was characterized by a mixed price momentum for the US dollar. While the US dollar was under pressure against the yen, this was offset by gains against commodity currencies such as the Australian dollar and the Canadian dollar.
–Are you interested to learn more about forex signals? Check our detailed guide-
Crude oil prices likely contributed to a 60-pip rise in the USD/CAD on Monday. CAD and oil have a strong positive correlation. Concerns about global growth and pressure on crude oil could keep the Canadian dollar at bay.
While the US dollar has not yet found a direction, the bulls and bears are arguing over whether the Fed will stop buying assets this year. As a result, the upcoming retail sales report could catalyst the Fed’s cut plan.
The retail sales report, released at 12:30 PM GMT on Tuesday, may introduce some volatility despite being not as important as inflation or employment data. However, it illustrates how strong economic indicators like retail sales can either bolster or undermine a report from last week that reported bad consumer sentiment.
However, positive retail sales data could put pressure on the Fed to start cutting asset purchases by the end of the year. Alternatively, FOMC officials may have to wait for retail sales numbers to improve amid a resurgence of Coronavirus fears and downside risks to the economy to adjust.
Assuming the first scenario plays out, the bullish side of the US dollar should jump to victory, whereas the bearish side of the US dollar could weaken sharply.
–Are you interested to learn more about day trading brokers? Check our detailed guide-
USD/CAD price technical analysis: Trend channel to provide resistance
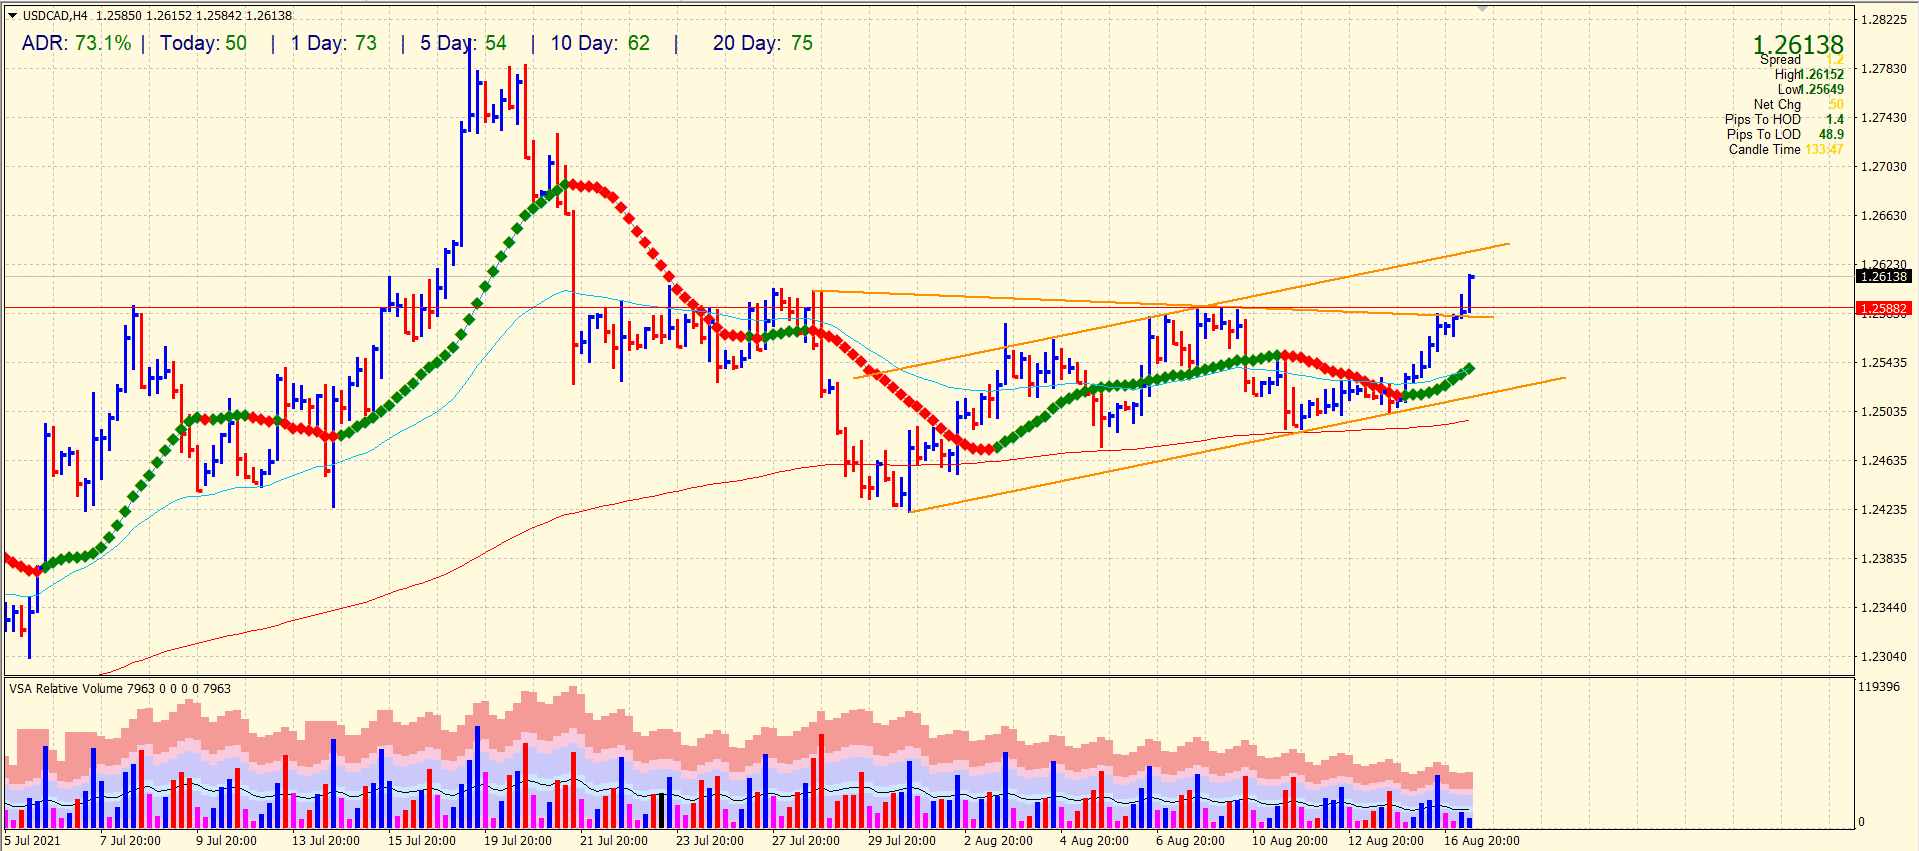
The USD/CAD price managed to clear the descending trendline resistance and is currently standing just above the psychological level of 1.2600. The 50-period and 20-period SMAs on the 4-hour chart are pointing upside. However, the 200-period SMA is flat. The pair have done a 73% average daily range so far. The next resistance for the pair lies at the upper band of the bullish trend channel. It is still left to see whether the bullish trend channel is really bullish or may act as a bearish flag pattern.
Looking to trade forex now? Invest at eToro!
67% of retail investor accounts lose money when trading CFDs with this provider. You should consider whether you can afford to take the high risk of losing your money.
