- The USD/CAD pair drops as the Dollar Index plunged in the short term.
- A sell-off was expected after registering false breakouts above the triangle’s resistance.
- A temporary rebound could bring new short opportunities.
The USD/CAD price drops like a rock after the Canadian inflation figures. The USD depreciated versus its rivals as the Dollar Index turned to the downside. The price was 1.2497 at the time of writing, far below 1.2646, yesterday’s high.
–Are you interested in learning more about forex bonuses? Check our detailed guide-
Technically, the price action signaled that the buyers were exhausted and that the bulls could take the lead again. The DXY has shown overbought signs in the short term, so a temporary correction was expected even though the US data came in better than expected yesterday. Building Permits came in at 1.87M above 1.83M expected, while the Housing Starts indicator was reported at 1.79M above 1.74M forecasts.
Today, the Canadian CPI reported a 1.4% growth in March versus 0.9% expected compared to 1.0% growth in February, while the Core CPI rose by 1.0% in the last month versus 0.5% in the previous reporting period. In addition, Common CPI, Median CPI, and the Trimmed CPI came in higher than expected.
The greenback took a hit from the US Existing Home Sales earlier. The economic indicator dropped from 5.93M to 5.77M, below 5.78M expected.
USD/CAD price technical analysis: Deeper correction
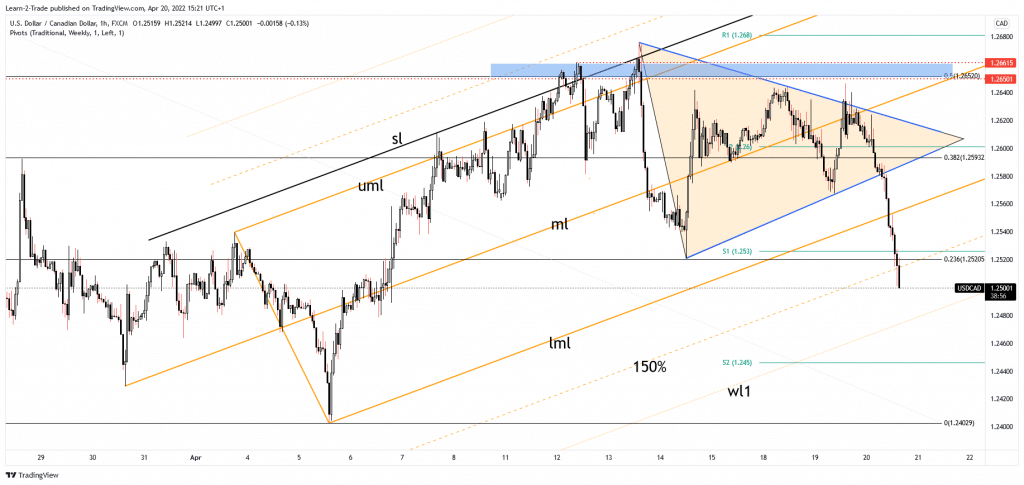
The USD/CAD pair developed a larger downside movement after registering false breakouts above the triangle’s resistance and through the ascending pitchfork median line (ml). In addition, the false breakouts above the triangle’s upside line signaled that we may have a downside breakout from this pattern.
–Are you interested in learning more about ETF brokers? Check our detailed guide-
As you can see from the 4-hour chart, the price ignored the ascending pitchfork’s lower median line (LML), the weekly S1 (1.2530), and the 150% Fibonacci line. These levels were seen as potential downside obstacles. Breaking below these levels signaled that we may have a larger drop.
The next downside obstacle is represented by the first warning line (wl1) of the ascending pitchfork. After its massive drop, we cannot exclude a potential rebound to help the sellers catch a new sell-off. Technically, the rebound was over after the price failed to stabilize above the 50% retracement level.
Looking to trade forex now? Invest at eToro!
68% of retail investor accounts lose money when trading CFDs with this provider. You should consider whether you can afford to take the high risk of losing your money
