The Japanese yen posted weekly gains for a fourth straight week, as the pair closed slightly above the 100 level. This week’s key event is Tokyo Core CPI. Here is an outlook for the highlights of this week and an updated technical analysis for USD/JPY.
Safe-haven flows continued to buoy the yen, which shrugged off a weak Japanese Preliminary GDP reading of 0.0%, short of expectations. In the US, the Fed’s minutes showed that only a small minority favors a rate hike, while the vast majority wants to continue to wait, notably because of low inflation levels.
do action=”autoupdate” tag=”USDJPYUpdate”/]
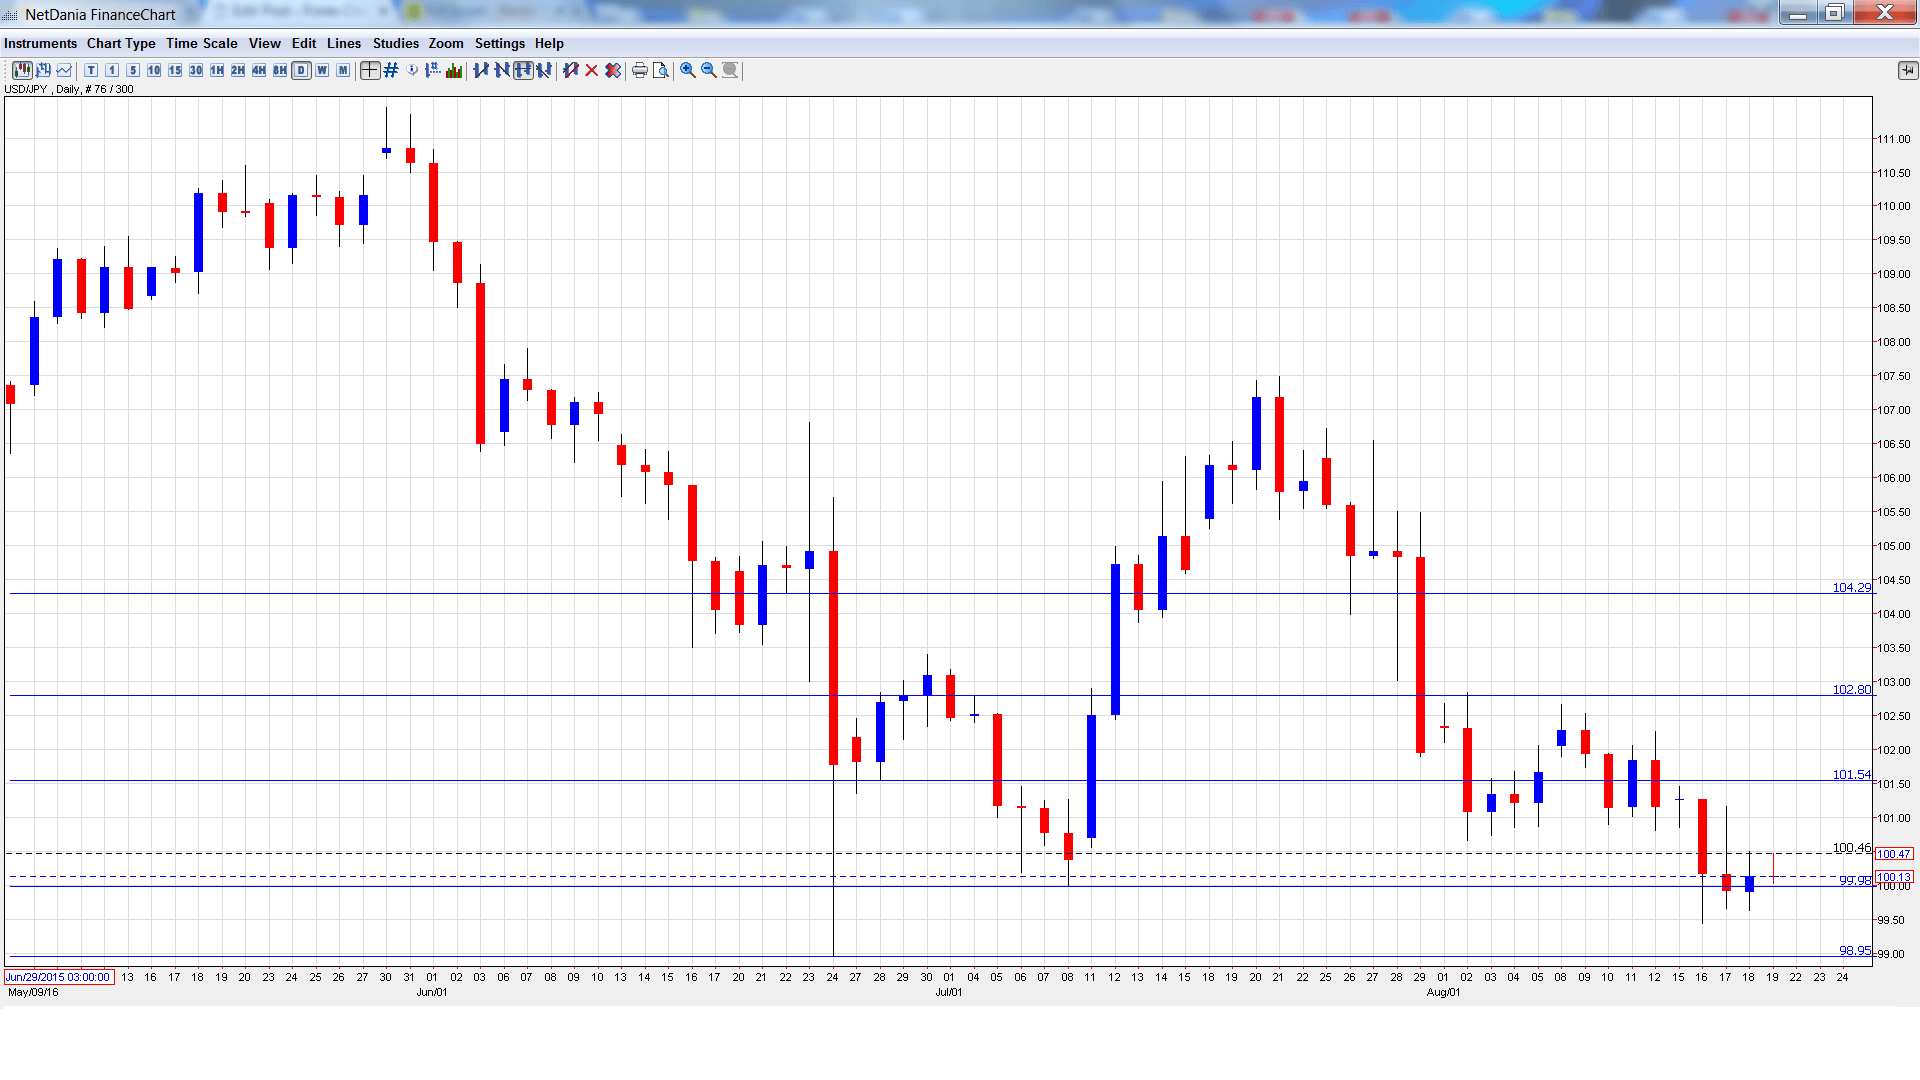
USD/JPY graph with support and resistance lines on it. Click to enlarge:
- Flash Manufacturing PMI: Tuesday, 2:00. The indicator has reeled off 5 straight declines, pointing to ongoing contraction in the Japanese manufacturing sector. The indicator improved to 49.0 in July, which was above the estimate of 48.3 points. Another decline is expected in the August reading, with a forecast of 49.5 points.
- BoJ Governor Haruhiko Kuroda Speaks: Monday, 4:00. Kuroda will speak at an event in Tokyo. The markets will be listening carefully, looking for clues as to the BoJ’s future monetary policy.
- SPPI: Wednesday, 23:50. This inflation index remains very steady, with the index pegged at 0.2% over the past 6 readings. The estimate for the July reading stands at 0.1%.
- Tokyo Core CPI: Thursday, 23:30. This is the key event of the week. The indicator has failed to post a gain in 2016, pointing to deflation. The index posted a decline of 0.4% in the July release and an identical reading is expected in August.
- National Core CPI: Thursday, 23:30. This inflation index has managed just one gain in 2016. The indicator contracted 0.5% in the previous reading and little change is expected in the upcoming release.
- BoJ Core CPI: Friday, 5:00. This minor indicator has posted two straight readings of 0.8%, within expectations each time. However, the indicator had been above the 1% level for most of the year, and another reading below 1% will put added pressure on the BoJ to take monetary action in the near future.
* All times are GMT
USD/JPY Technical Analysis
USD/JPY opened the week at 101.25 and quickly touched a high of 101.45, as resistance held at 101.51 (discussed last week). The pair then reversed directions and dropped to a low of 99.45. USD/JPY closed the week at 100.13.
Live chart of USD/JPY: [do action=”tradingviews” pair=”USDJPY” interval=”60″/]
Technical lines from top to bottom:
104.25 has held in resistance since late July.
102.80 is next.
101.51 held firm early in the week as USD/JPY moved higher before retracting.
99.98 was tested in support and is currently a weak support line.
98.95 has held in support since late June.
97.61 was last tested in November 2013.
96.56 is the final support level for now.
I am neutral on USD/JPY
The yen could continue to post gains and break below 100 if the markets feel that the BoJ will not adopt further easing. At the same time, although the Fed is very unlikely to raise rates in September, there is a reasonable chance of a December move. This means that any strong US releases will raise speculation about a hike and could send the greenback to higher levels.
Our latest podcast is all about the Fed’s forecast failures.
Follow us on Sticher or iTunes
Further reading:
- For a broad view of all the week’s major events worldwide, read the USD outlook.
- For EUR/USD, check out the Euro to Dollar forecast.
- For the Japanese yen, read the USD/JPY forecast.
- For GBP/USD (cable), look into the British Pound forecast.
- For the Canadian dollar (loonie), check out the Canadian dollar forecast.
- For the kiwi, see the NZD/USD forecast
