AUD/USD remains at high levels, but had an uneventful week, posting modest losses. The pair closed the week at 0.9329. This week’s schedule is light, highlighted by CPI. Here is an outlook on the major market-movers and an updated technical analysis for AUD/USD.
In Australia, Business Confidence and New Motor Vehicle Sales both lost ground in March. Over in the US, Unemployment Claims looked sharp for a second straight week, but dovish comments by Fed chair Janet Yellen weighed on the greenback.
[do action=”autoupdate” tag=”AUDUSDUpdate”/]AUD/USD graph with support and resistance lines on it. Click to enlarge: 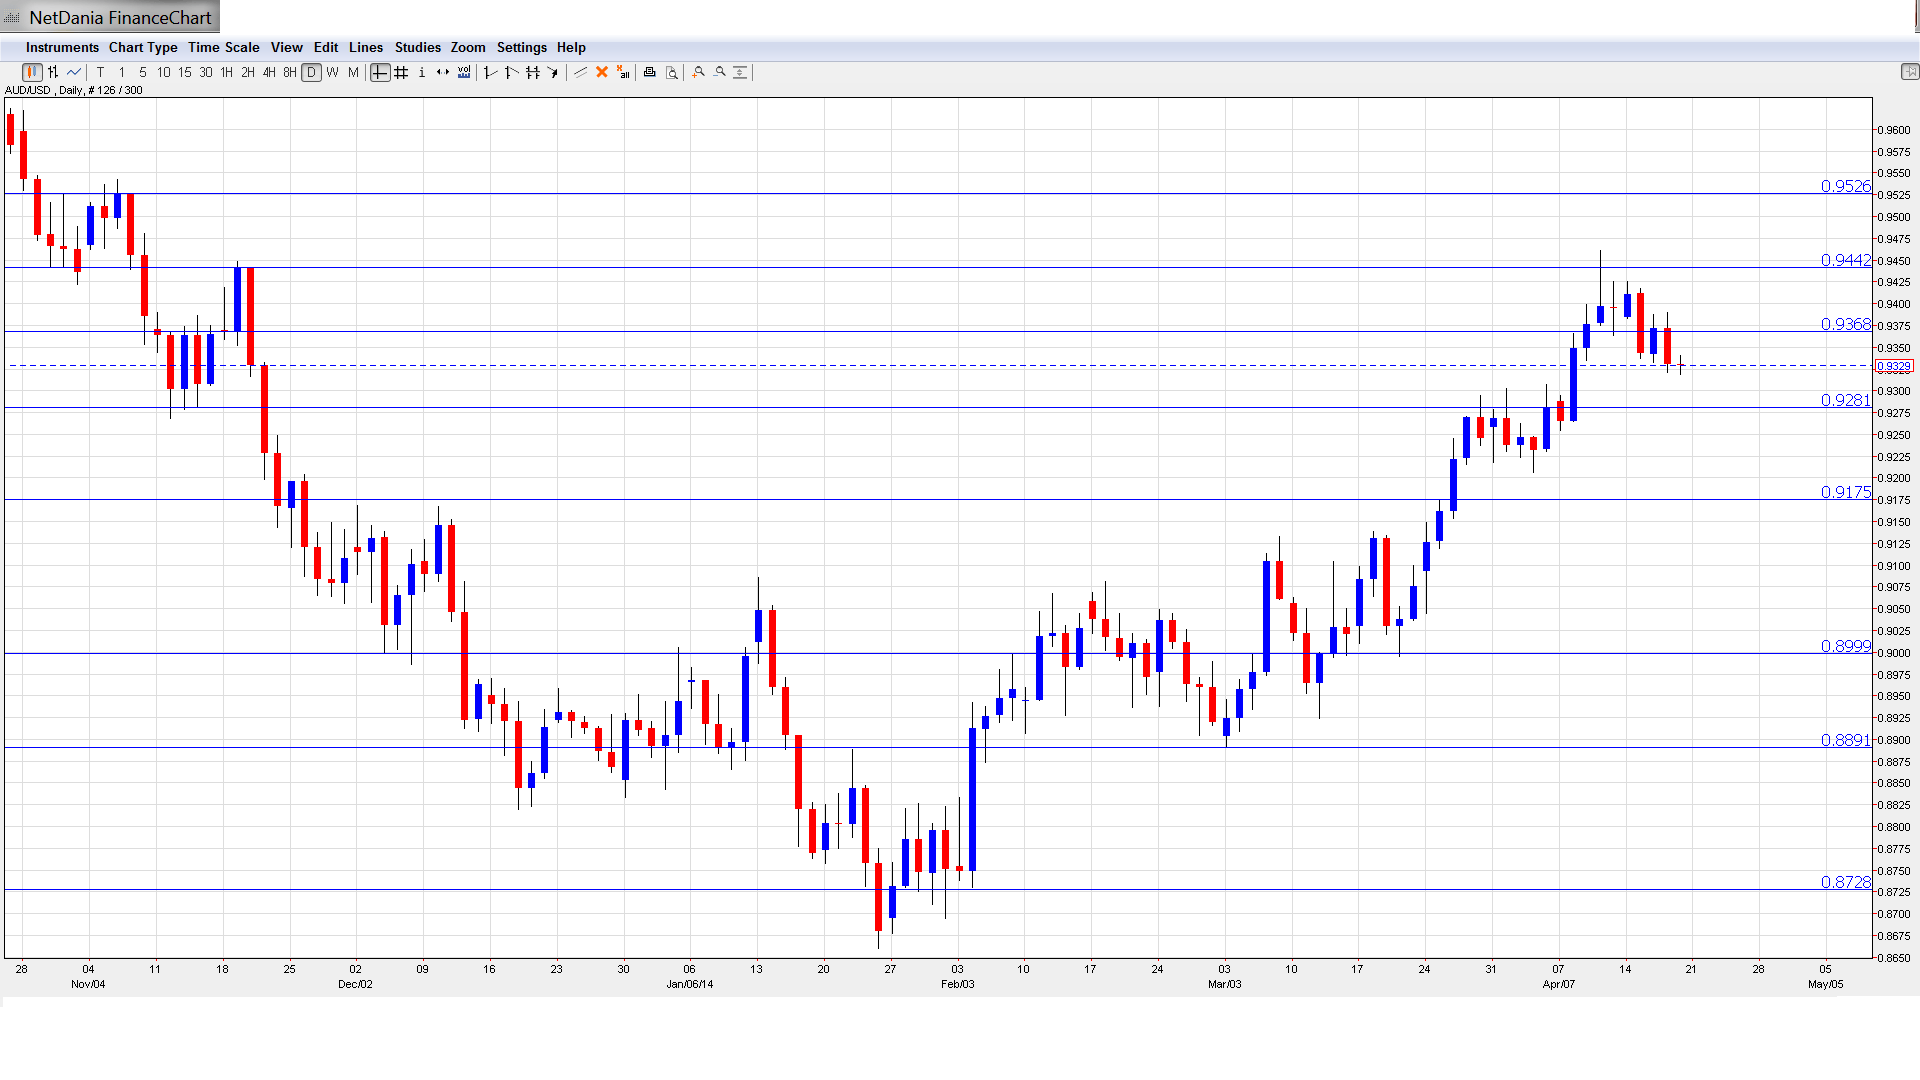
- CB Leading Index: Tuesday, 00:00. This important index is based on 7 economic indicators. The indicator posted a weak gain of 0.2% last month, and the markets are hoping for some improvement in the upcoming release.
- CPI: Wednesday, 1:30. CPI, released each quarter, is the major event of the week. It is the primary gauge of consumer spending and can have a major impact on the movement of AUD/USD. The indicator posted a respectable gain of 0.8% in Q4, surpassing the estimate of 0.5%. The forecast for the Q1 reading stands at 0.8%.
- Trimmed Mean CPI: Wednesday, 1:30. This index excludes the most volatile 30% items which comprise CPI. The Q4 reading improved to 0.9%, beating the estimate of 0.6%. This was the best showing since 2011. The estimate for Q1 is 0.7%.
- Chinese HSBC Flash Manufacturing PMI: Wednesday, 1:45. Key Chinese indicators such as PMI releases can have a significant impact on AUD/USD, since China is Australia’s number one trading partner. Flash Manufacturing PMI remains under the 50-point level, pointing to contraction in the manufacturing sector. Little change is expected in the March release, with the estimate standing at 48.3 points.
*All times are GMT.
AUD/USD Technical Analysis
AUD/USD opened the week at 0.9384. The pair quickly climbed to a high of 0.9425, as resistance at 0.9442 (discussed last week) remained intact. The pair then reversed directions, dropping to 0.9319 before closing at 0.9329.
Technical lines from top to bottom:
We start with the round number of 0.99, a key resistance level.
Next is 0.9794, which was last tested in June 2013.
There is resistance at the round number of 0.9700, which has held firm since October 2013.
0.9526 provided key resistance in November 2013 and has remained intact since that time.
0.9442 held firm as AUD/USD pushed above the 0.94 before retracting. The line marked the high point of the pair in November, which saw the Aussie go on a sharp slide and drop below the 0.89 line.
0.9368 was breached for a second straight week, and has switched to a resistance role. It is a weak line, and could see activity early in the week.
0.9283 marks the first support level. It has weakened as the Aussie lost ground last week. This line saw a lot of action in the months of June and July, alternating between resistance and support roles. This is followed by stronger support at 0.9180.
The round number of 0.9000 is a key psychological level. It has remained intact since early March. AUD/USD has posted impressive gains since then. 0.8893 is the next support line.
The final support level for now is 0.8728. It marks the low point of an Aussie rally which began in early February and pushed above the 0.94 line.
I am neutral on AUD/USD.
AUD/USD remains at high levels, despite remarks from the RBA that the Aussie is too high for its liking. The US dollar has been under pressure after dovish comments from the Federal Reserve, but employment claims have looked solid for the past two readings, boosting the likelihood of another QE trim at the end of April, which is a dollar-positive event.
- For a broad view of all the week’s major events worldwide, read the USD outlook.
- For EUR/USD, check out the Euro to Dollar forecast.
- For the Japanese yen, read the USD/JPY forecast.
- For GBP/USD (cable), look into the British Pound forecast.
- For the Australian dollar (Aussie), check out the AUD to USD forecast.
- USD/CAD (loonie), check out the Canadian dollar.
