AUD/USD plunged last week, as the pair fell to 0.7360. This marks the pair’s lowest level since late February. There are seven events this week. Here is an outlook on the major market-movers and an updated technical analysis for AUD/USD.
The Aussie posted sharp losses after the RBA surprised with a rate cut and again following the RBA’s policy statement. In the US, Nonfarm Payrolls was dismal, falling to 160 thousand.
As expected, the Federal Reserve remained on the sidelines and did not raise interest rates. US Advance GDP came in at 0.5%, short of the estimate. Australian CPI was unexpectedly soft, posting a decline of 0.2%.
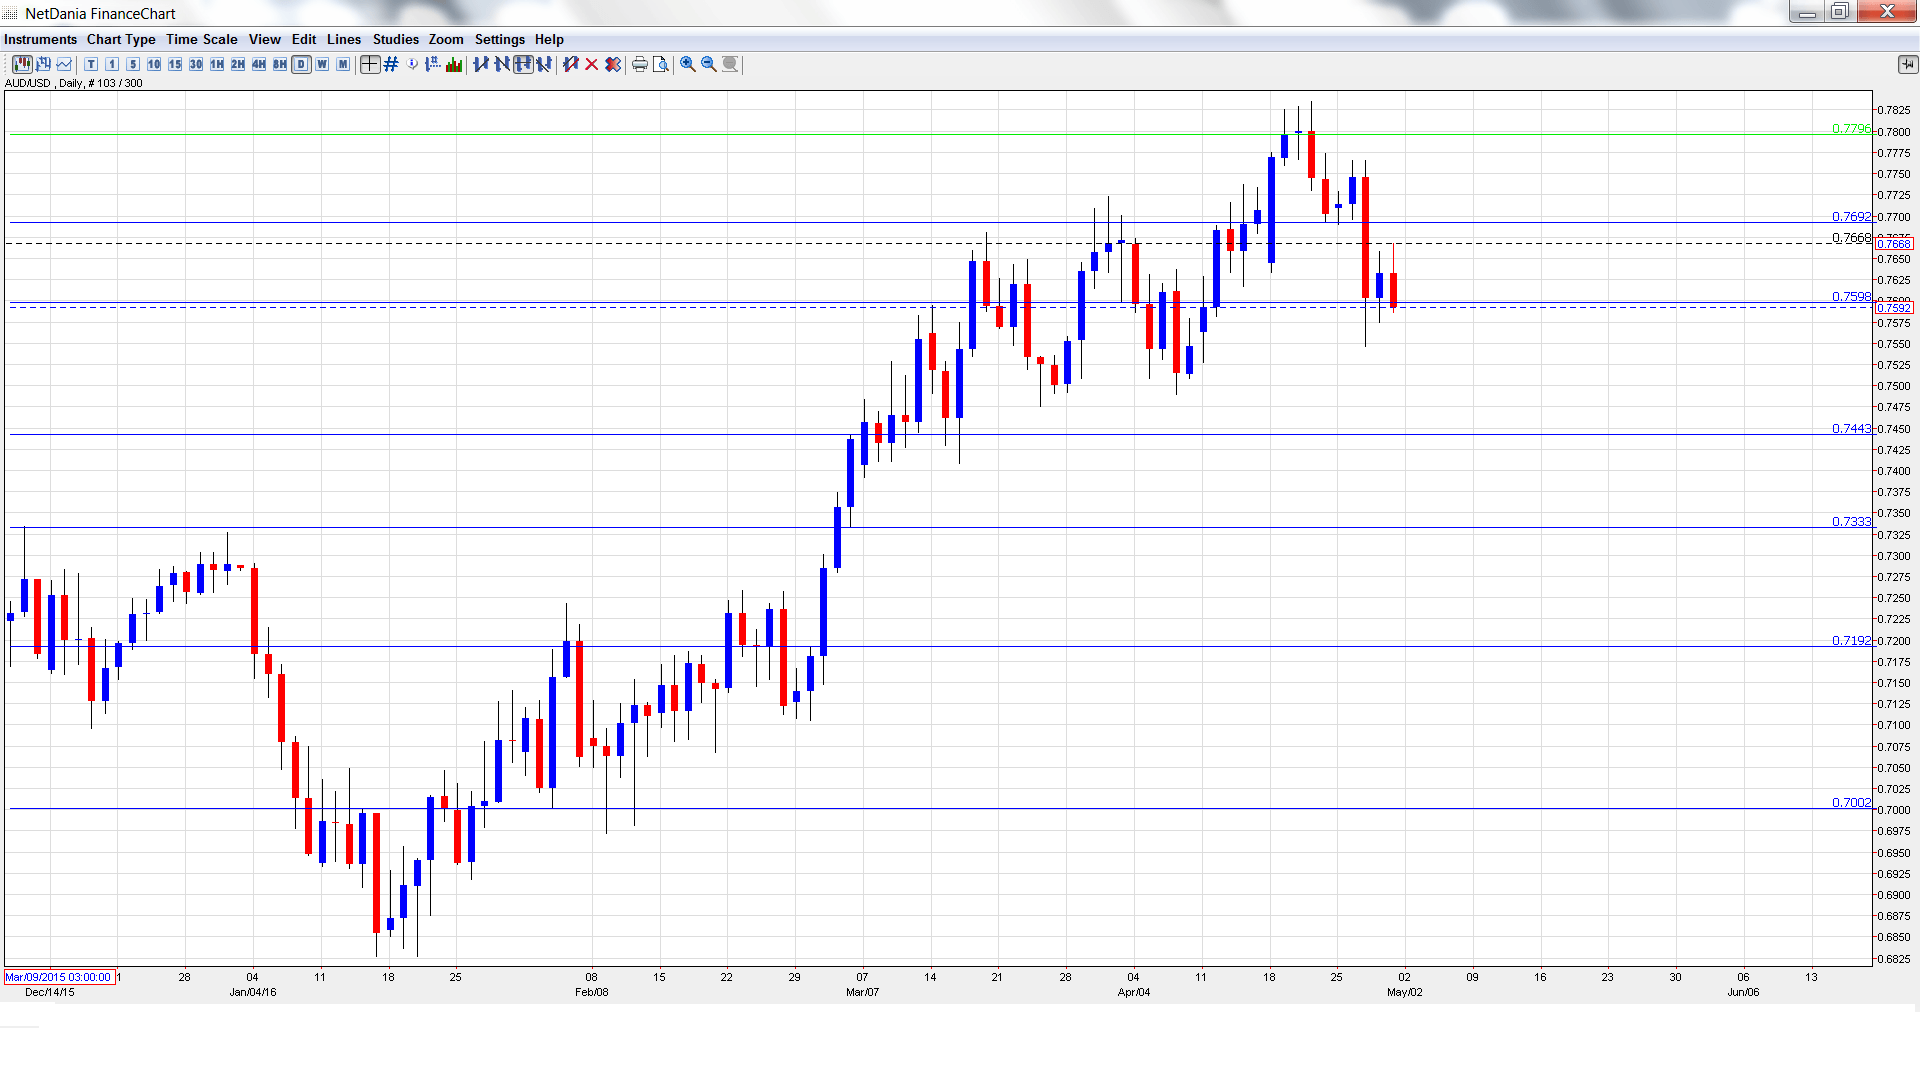
[do action=”autoupdate” tag=”AUDUSDUpdate”/]AUD/USD graph with support and resistance lines on it. Click to enlarge:
- Chinese Trade Balance: Sunday, Tentative. Chinese key indicators can have a strong impact on the Australian dollar, as China is Australia’s largest trade market. Chinese Trade Balance jumped to $298 billion in April, well above the forecast of $250 billion. The increase reflects stronger overseas demand for Chinese products.
- ANZ Job Advertisements: Monday, 1:30. This indicator provides a snapshot of the strength of the employment market. In March, the indicator rebounded with a small gain of 0.2%.
- Westpac Consumer Sentiment: Wednesday, 00:30. Consumer confidence is closely connected to consumer spending, a key component of economic activity. The indicator has struggled, posting four declines in five readings. The April release was dismal, posting a decline of 4.0%. Will we see any in improvement in the May report?
- Home Loans: Wednesday, 1:30. Home Loans bounced back with a gain of 1.5% in February, but this fell short of the forecast of 2.1%. The markets are braced for a downturn in March, with an estimate of -1.4%.
- RBA Assistant Governor Malcolm Edey Speaks: Wednesday, 23:00. Edey will speak at a conference in Melbourne. A speech which is more hawkish than expected is bullish for the Australian dollar.
- MI Inflation Expectations: Thursday, 1:00. This indicator helps analysts in their projections of actual inflation. The indicator has been stable, and came in at 3.6% in March.
- Chinese Industrial Production: Saturday, 5:30. Industrial Production was unexpectedly strong in March, posting a gain of 6.8%. This was above expectations and marked an 8-month high. The indicator is expected to soften in April, with the estimate standing at 6.5%.
* All times are GMT
AUD/USD Technical Analysis
AUD/USD opened the week at 0.7614. The pair touched a high of 0.7718 early in the week. AUD/USD then changed directions and dropped all the way to 0.7336, as support held firm at 0.7334 (discussed last week). AUD/USD closed the week at 0.7360.
Live chart of AUD/USD: [do action=”tradingviews” pair=”AUDUSD” interval=”60″/]
Technical lines from top to bottom:
0.7798 was an important resistance line for much of June 2015.
0.7692 is protecting the 0.77 line.
0.7597 is the next line of resistance.
0.7438 has switched to a resistance role following sharp losses from AUD/USD.
0.7334 was a cap December 2015. It is a weak line and could see action early in the week.
0.7192 is the next support line.
0.7002 is the final support level for now.
I am bearish on AUD/USD
The RBA was responsible for pushing the Aussie sharply lower, and has left the door open to another rate cut in August. The Fed is moving in the opposite direction, with a June hike a reasonable possibility. So, monetary divergence will continue to weigh on the Aussie.
In our latest podcast we examine: Markets vs. Trump vs. Clinton
Follow us on Sticher or on iTunes
Further reading:
- For a broad view of all the week’s major events worldwide, read the USD outlook.
- For EUR/USD, check out the Euro to Dollar forecast.
- For the Japanese yen, read the USD/JPY forecast.
- For GBP/USD (cable), look into the British Pound forecast.
- For the Canadian dollar (loonie), check out the Canadian dollar forecast.
- For the kiwi, see the NZD/USD forecast
