The Canadian dollar expects 4 events in the upcoming week, after rising against the greenback. Here’s an outlook for these events and an updated technical analysis for USD/CAD.
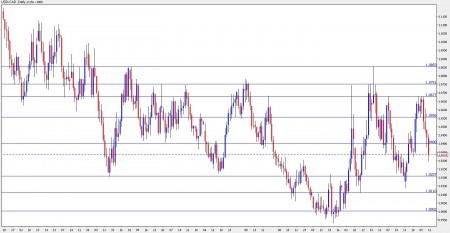
USD/CAD daily chart with support and resistance lines. Click to enlarge:
Excellent employment figures on Friday gave a huge boost to the loonie. It seems that the Canadian economy is doing well, regardless of oil prices. Let’s start:
- BOC Business Outlook Survey: Published on Monday at 14:30 GMT. This quarterly report always has a strong impact on the loonie. The survey of 100 businesses describe their sentiment towards the economy for the next quarter. A good report is expected this time, showing sustainable growth.
- Trade Balance: Published on Tuesday at 12:30 GMT. Canada enjoys a surplus in the trade balance for already 5 months, although this surplus squeezed to only 200 million last month. It’s now expected to grow to 400 million. Note that the American trade balance is released at the same time, and this always means volatile trading in USD/CAD around this release.
- Manufacturing Sales: Published on Thursday at 12:30 GMT. This important indicator was positive in the past 8 months, growing nicely in most months. After a rise of 0.2% in factory sales, a rise of 0.4% is predicted now.
- Leading Index: Published on Friday at 12:30 GMT. Most of the 10 components of this index have already been released. Nevertheless, the release tends to surprise and shake the Canadian dollar. After a strong rise of 0.9% last month, a more modest rise of 0.5% is expected now.
USD/CAD Technical Analysis
At the beginning of the week, USD/CAD retested the 1.0680 resistance line that it already encountered in the previous week. Later on, it fell below 1.0550 and made a break under 1.04 on Friday to close at 1.0335.
The pair is back to the 1.02 to 1.04 range. Note that some lines changed since last week’s outlook. 1.04 was the bottom line of the long-term 1.04 to 1.0750 range, and is now a resistance line.
Above, 1.0550 is a minor line of resistance, working as such in recent months. A more important line is 1.0680, that proved its strength in the past two weeks.
Above, 1.0750 is the next strong line, last tested in May. Also 1.0.850 was tested in May. Both lines were also significant in 2009.
Looking down, 1.02 provides immediate support. This was the 2009 low. Below, 1.01 provides minor support. 1.01 worked as a resistance line after the pair hit parity in April.
Below, the magic parity line provides support. In case the pair falls below 1, the next support line is found at 0.98 and then 0.97.
I remain bearish on USD/CAD.
As seen in the employment figures, the Canadian economy is doing great, and this should be reflected in USD/CAD as well.
Further reading:
- For a broad view of all the week’s major events worldwide, read the forex weekly outlook.
- For EUR/USD, check out the Euro/Dollar Forecast.
- For GBP/USD (cable), look into the British Pound forecast.
- For the Australian dollar (Aussie), check out the AUD/USD forecast.
- For the New Zealand dollar (kiwi), read the NZD/USD forecast.
- For USD/CAD (loonie), check out the Canadian dollar forecast.
Ready to connect with real Forex traders? Currensee is the first Forex trading social network.

