The loonie will move on US data during most of the week, but the busy end of the week promises tension. Here’s an outlook for the Canadian events, and an updated technical analysis for USD/CAD.
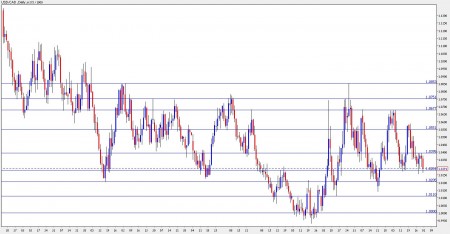
USD/CAD daily chart with support and resistance lines on it. Click to enlarge:
Canada’s monthly GDP rose by 0.1%, exactly as expected, and kept USD/CAD rather stable. Will we see another jump in employment?
- Building Permits: Published on Thursday at 12:30 GMT. This important housing figure is very volatile. It fell by double digits last month (10.8%), but it’s important to remember that it made a similar leap three months ago (12.2%). It’s now expected to rise by a very modest 0.6% – expect surprises. This always shakes the loonie.
- Employment data: Published on Friday at 11:00 GMT. After a huge leap of 93,200 jobs last month, a very modest rise of 10,300 jobs is expected this time, in the employment change figure. The unemployment rate, which unexpectedly dropped to 7.9% is expected to stay unchanged this time. The timing, 90 minutes before the American Non-Farm Payrolls, always promises action on USD/CAD, even if the Canadian figures will indeed be tame as expected.
- Ivey PMI: Published on Friday at 14:00 GMT. The week isn’t over for the loonie. The Richard Ivey Business School has a major PMI number to end the week. From a good score of 58.9 points, the score is predicted to edge down to 56.3 – still above 50, meaning economic expansion.
USD/CAD Technical Analysis
This week’s trading was dominated by a tight range – 1.0280 to 1.04. Two false breakouts were seen to the downside – USD/CAD went as low as 1.0256 but quickly returned to the range, and closed at 1.0291.
Most lines haven’t changed since last week’s outlook. The same range continues into the next week. 1.04 was the long term bottom border of the 1.04 to 1.0750 range, and now works as a tough resistance line. Above, 1.0550 capped the pair several times in the past, and is a minor line of resistance.
The next line of resistance is at 1.0680, which capped the pair in June and several times in July. Apart from being the long term top border of the range, 1.0750 was also tested in May. Even higher, 1.0850 was a swing high in 2009 and a swing high in May as well.
Looking down below 1.0280, the 2009 low of 1.02 is the next line of support. Note that it also worked as resistance after the pair hit parity in April. Lower, 1.01 is a minor line of resistance, and it’s followed by the ultimate support line – parity.
I remain bearish on USD/CAD.
The improving Canadian economy, rising interest rate and fresh jobs data should boost the loonie. Also note that a breakout of oil prices above $80 per barrel will fuel the Canadian dollar.
Further reading:
- For a broad view of all the week’s major events worldwide, read the USD outlook.
- For EUR/USD, check out the Euro/Dollar Forecast.
- For GBP/USD (cable), look into the British Pound forecast.
- For the Australian dollar (Aussie), check out the AUD/USD forecast.
- For the New Zealand dollar (kiwi), read the NZD/USD forecast.
- For USD/CAD (loonie), check out the Canadian dollar forecast.
Want to see what other traders are doing in real accounts? Check out Currensee. It’s free..

