The Canadian dollar was very stable against the greenback, in a week which saw many currencies rock. Retail sales and Inflation data are the major market movers this week. Here’s an outlook for the Canadian events and an updated technical analysis for USD/CAD.
One of the things that kept the loonie higher, was the situation around Iran. Here are 5 signs that a war in Iran is getting closer. Canada enjoys higher oil prices. Last week some negative readings were released with Foreign Securities Purchases plunging to -4.19 billion in January from 8.17 billion in December and below the 6.27 billion expected and Manufacturing Sales dropped 0.9% in January while predicted a 0.4% gain. Will we see better figures this week?
Updates: USD/CAD is steady, trading at 0.9914. Wholesale Sales disappointed, contracting by 1%, This was the worst reading in almost two years. Despite higher oil prices, the loonie lost a bit of ground, falling under the 0.99 line, trading at 0.9894. Leading Index was up by 0.6%.
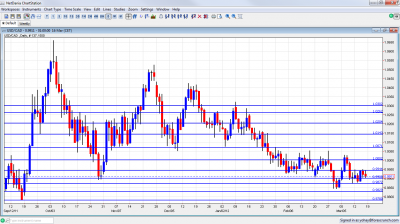
USD/CAD daily chart with support and resistance lines on it. Click to enlarge:
- Wholesale Sales: Monday, 12:30. Canadian wholesale trade increased more than anticipated in December rising 0.9% after a drop of 0.3% in November. Nevertheless the general trend is positive indicating expansion in the manufacturing sector and consumer spending. The main rise occurred in auto and food sales. A further gain of 0.5% is expected now.
- Leading Index: Wednesday, 12:00. Canada’s leading indicator continued its growth trend by climbing 0.7% in January. The increase was higher than the 0.6% predicted by analysts. The housing index increased while the retail sector softened. A rise of 0.5% is anticipated.
- Retail sales: Thursday, 12:30. Retail sales dropped 0.2% during the holiday season, in line with expectations, while Core sales were flat after a 0.4% gain in November. Nevertheless the economy does not show signs of weakness. The decline was led by lower energy prices and automobile sales. The general improvement in the US market and Greece’s debt resolution gave boost to the Canadian economy. Retail sales is expected to grow 1.8% while core sales is predicted to gain 0.6%.
- Inflation data: Friday, 11:00. Canada’s CPI gained 0.4% in January following a 0.6% decline in December. On a yearly base, CPI gained 2.5% above the 2.3% rise expected by analysts. Meanwhile, core CPI, excluding food and energy prices, increased 0.2% in January after dropping 0.5% in the previous month rising above predictions of 0.1% increase. Headline inflation is forecasted to gain 0.5% while core CPI is expected to add 0.2%.
* All times are GMT.
USD/CAD Technical Analysis
$/C$ found an early top at around 0.9950, and traded between 0.99 and sometimes 0.9870 and the new 0.9950 (which didn’t appear last week). All in all, the pair finished a bit higher, but hardly moved.
Technical lines, from top to bottom:
The round number of 1.03 was the peak of a move upwards seen in November 2010 and has found new strength after working as a cap in January 2012. 1.0263 is the peak of surges during October, November and December, but was shattered after the move higher. It’s far at the moment..
The round figure of 1.02 was a cushion when the pair dropped in November, and also the 2009 trough. It is weaker now but remains pivotal. 1.0143 was a swing low in September and worked as resistance several times afterwards.
Closer to parity, 1.0070 provided support around the turn of the year, and with the narrowing ranges, is now further away. The very round number of USD/CAD parity is a clear line of course, and was a line of battle that eventually saw the pair fall lower.
Under parity, we have a new line at 0.9950. It served as a top border to range trading in March 2012. The round number of 0.99 provided support on a fall during October and also served as resistance back in June. It is now a pivotal line in the middle of the range.
0.9870 was a trough reached once and challenged afterwards, and serves a bottom border of the range. 0.9830 provided support for the pair during September and is now stronger after a first attempt to breach it failed.
0.9780, where the current run began is the next and important support line. It is closely followed by 0.9736, which provided support during August 2011.
The veteran 0.9667 line worked as support at the beginning of 2011 and then for several months during the spring. It is a very clear and strong line on the chart. 0.9550 worked as support during April and also June and is minor now.
0.9406 was the trough in July 2011 and is the final frontier for now. Below this line, its back to 2007.
I remain neutral on USD/CAD.
Oil prices continue supporting the Canadian dollar, and so do the tensions with Iran. As long as prices aren’t too high (hurting the US economy), Canada is better. The stronger US economy gets a better acknowledgement from the Fed, and this keeps the greenback up. Note that some traditional correlations broke down.
Further reading:
- For a broad view of all the week’s major events worldwide, read the USD outlook.
- For EUR/USD, check out the Euro to Dollar forecast.
- For the Japanese yen, read the USD/JPY forecast.
- For GBP/USD (cable), look into the British Pound forecast.
- For the Australian dollar (Aussie), check out the AUD to USD forecast.
- For the New Zealand Dollar (kiwi), read the NZD forecast.
- For USD/CAD (loonie), check out the Canadian dollar forecast
- For the Swiss Franc, see the USD/CHF forecast.
