The Canadian dollar remained in range against the greenback, despite the global turmoil. After a very busy week, the upcoming one is relatively more light. Here’s an outlook for the Canadian events and an updated technical analysis for USD/CAD.
The BOC decided to maintain its overnight rate and employment market revealed mixed results starting with an unexpected contraction of 2,800 jobs in February, way below the 14,200 increase predicted by analysts. Meanwhile, the unemployment rate dropped to 7.4% in February although expected to remain 7.6% as in the previous month. Let’s see what awaits us this week.
Updates: Employment Change was a huge disappointment, falling by 2.8K. The markets had forecast an increase of 14.2K. The umemployment rate improved slightly to 7.4%. Trade balance dropped to 2.1B, as the markets predicted. USD/CHF is drifting at the 0.99 level. The markets are awaiting Fed Chairman Bernanke’s speech, which can be a market mover for USD/CAD. The pair is showing little movement, trading at 0.9909. Capacity Utilization Rate showed little change, at 80.5%. New Motor Vehicle Sales shot up 15.4%.
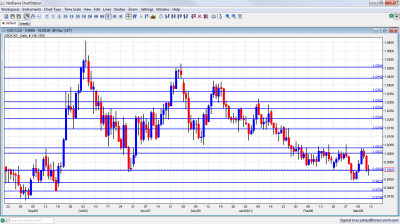
USD/CAD daily chart with support and resistance lines on it. Click to enlarge:
- Capacity Utilization Rate: Wednesday, 16:30. Canadian production capacity climbed in the third quarter of 2011 to 81.3% from 79.9% in the second quarter above the 79.0% figure predicted by analysts. Canadian manufacturing, capacity utilization are in a long growth trend since 2009. Production capacity is expected to climb further to 81.6%.
- Foreign Securities Purchases: Friday, 12:30. Foreign net purchases of Canadian securities dropped in December to C$7.38 billion following a revised $14.6 billion in November. The yearly total also declined to C$95.6 billion from C$117.4 billion in 2010. Another decline to C$6.27 billion is predicted now.
- Manufacturing Sales: Friday, 12:30. Canadian manufacturing sales increased less than expected in December rising 0.6% to $49.9-billion after gaining 1.9% in November. Economists expected 1.0% climb. Transportation equipment was the major contributor for this rise. The annual total of factory sales reached $571-billion, up 7.8% from 2010. An increase of 0.6% is forecasted now.
* All times are GMT.
USD/CAD Technical Analysis
Dollar/CAD gradually rose during the week and peaked just under 1.0030, new line that joins the chart. It then changed course and fell and closed at 0.9906, just above the aforementioned 0.99 line.
Technical lines, from top to bottom:
The 1.0440 line worked as support when the pair was trading at higher ground during November and was tested successfully also in December, making it stronger. 1.0360 capped the pair in September and October and also provided support. It is weaker now.
The round number of 1.03 was the peak of a move upwards seen in November 2010 and has found new strength after working as a cap in January 2012. 1.0263 is the peak of surges during October, November and December, but was shattered after the move higher. It’s far at the moment..
The round figure of 1.02 was a cushion when the pair dropped in November, and also the 2009 trough. It is weaker now but remains pivotal. 1.0143 was a swing low in September and worked as resistance several times afterwards.
Closer to parity, 1.0030 was a double top in March, and serves as another cap after parity. The very round number of USD/CAD parity is a clear line of course, and was a line of battle that eventually saw the pair fall lower.
Under parity, the round number of 0.99 provided support on a fall during October and also served as resistance back in June. The break below this line in March 2012 was very decisive. 0.9830 provided support for the pair during September and is now stronger after a first attempt to breach it failed.
0.9780, where the current run began is the next and important support line. It is closely followed by 0.9736, which provided support during August 2011.
The veteran 0.9667 line worked as support at the beginning of 2011 and then for several months during the spring. It is a very clear and strong line on the chart. 0.9550 worked as support during April and also June and is minor now.
0.9406 was the trough in July 2011 and is the final frontier for now. Below this line, its back to 2007.
I am neutral on USD/CAD.
Oil prices remain high, but not too high. This is positive for Canada’s oil exports, and it doesn’t hurt the US so far. A bigger rise could inflict damage. The mixed employment figures and the mixed assessment of the BOC will likely keep the pair in range.
The loonie seems rather immune to events in Europe, contrary to other commodity currencies.
Further reading:
- For a broad view of all the week’s major events worldwide, read the USD outlook.
- For EUR/USD, check out the Euro to Dollar forecast.
- For the Japanese yen, read the USD/JPY forecast.
- For GBP/USD (cable), look into the British Pound forecast.
- For the Australian dollar (Aussie), check out the AUD to USD forecast.
- For the New Zealand Dollar (kiwi), read the NZD forecast.
- For USD/CAD (loonie), check out the Canadian dollar forecast
- For the Swiss Franc, see the USD/CHF forecast.
