USD/CAD moved higher for a second week in a row, despite stronger Canadian figures. Oil wasn’t helpful at all. Ivey PMI, Housing and employment data ate the highlight of this week. Here is an outlook on the major market-movers and an updated technical analysis for USD/CAD.
Canadian retail sales surged by an unexpected 0.7% in July from a 0.3% decline in June while core sales excluding automobiles climbed 0.4% offsetting the 0.4% decline in the preceding month. Both readings topped expectations paving the way to another pleasant surprise. GDP release came out better than forecasted, expanding by 0.2%, above the 0.1% increase predicted. Will the Canadian economy continue to increase the pace of growth in the coming months?
Updates: RMPI climbed 3.4%. This marked the manufacturing index’s largest gain since January. IPPI dropped a very modest 0.1%. This was below the estimate of a 0.1% increase. USD/CAD is choppy, as the pair was trading at 0.9816. Ivey PMI will be released later on Thursday. The markets are predicting a sizable decline in the reading. BOC Senior Deputy Governor Tiff Macklem will address the Manitoba Chamber of Commerce in Winnipeg. USD/CAD continues to move in a narrow range, as the pair was trading at 0.9865.
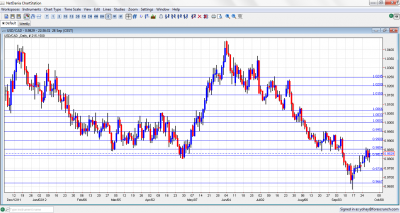
USD/CAD daily chart with support and resistance lines on it. Click to enlarge:
- RMPI : Monday, 12:30.Canada’s Raw material prices advanced 0.9% in July following a 4.1% plunge in the preceding month. This was the first monthly rise in six months, amid higher prices for crude oil and vegetable products. Meanwhile, producer price index declined for the third consecutive month, down 0.5% from June due to lower prices for chemical products and motor vehicles. Raw material prices are expected to climb 1.3%.
- Ivey PMI: Thursday, 14:00. A modest decline was registered in Ivey Purchasing Managers Index showing seasonally adjusted 62.5 during August from62.8 in July. The reading was better than analysts had expected still reflecting expansion. A drop to 58.9 is forecasted.
- Tiff Macklem speaks: Thursday, 17:30. BOC Senior Deputy Governor Tiff Macklem will speak inWinnipeg at the Manitoba Chambers of Commerce.
- Building Permits: Friday, 12:30. The value of building permits issued in Canada dropped 2.3% in July after a flat reading in the previous month. This decline occurred amid a contraction in multi-family residential projects signaling the housing market is cooling down after posting strong readings in the previous months. Economists expected a smaller drop of 1.5%. Another decline of 5.7% is expected this time.
- Employment data: Friday, 12:30. The Canadian economy added 34,300 jobs in August, offsetting the 30,400 jobs, beating expectations of a 10,000 gain. All the job gains were part time, replacing the part-time losses in July. However despite the rise, unemployment rate remained at 7.3%, in line with predictions, since more Canadians sought employment in August. Canada has regained all the jobs lost in the recession, and employment stands 176,600 higher than in August 2011, with a majority increase in full-time positions. A gain of 15.300 jobs is expected with the same unemployment rate of 7.3%.
* All times are GMT.
USD/CAD Technical Analysis
USD/C$ challenged the 0.9817 line (mentioned last week) before sliding lower. A second attempt was more successful and the pair continued trading choppily, with 0.9817 serving as a clear separator.
Technical lines, from top to bottom:
1.0066 was key support before parity. It’s strength during July 2012 was clearly seen and it gave a fight before surrendering. Now, it is somewhat weaker. 1.0030 is another line of defense before parity after capping the pair earlier in the year. The move below this line is not confirmed yet.
The very round number of USD/CAD parity is a clear line of course, and the battle was very clear to see at the beginning of August 2012. Under parity, 0.9950 is now the top border of the range, similar to a role it played in March 2012. It also worked well as resistance in August 2012, in more than one occasion.
0.99, the round number capped the pair in May 2012, was a pivotal line in the middle of the range during the summer of 2012. 0.9854 joins the chart as another line of resistance after working as such during September 2012.
0.9817 was a stubborn peak in September and is now significant resistance. Lower, 0.9725 worked as strong support back at the fall of 2011.
0.9667, which was another strong cushion in June 2011 is the next line. The round number of 0.96 provided some support back in 2011 and is minor now.
Further below we find 0.9550, which worked as resistance when the pair traded in low ground. 0.9450 also provides some support on the way down.
The ultimate line of support is 0.9406, which was the bottom in 2011 and the lowest since the financial crisis broke out.
I remain neutral on USD/CAD.
On one hand, the Canadian economy is strong and the upcoming job figures could certainly help. On the other hand, the price of oil isn’t helping the loonie and also the global weakness weighs on it.
Further reading:
- For a broad view of all the week’s major events worldwide, read the USD outlook.
- For EUR/USD, check out the Euro to Dollar forecast.
- For the Japanese yen, read the USD/JPY forecast.
- For GBP/USD (cable), look into the British Pound forecast.
- For the Australian dollar (Aussie), check out the AUD to USD forecast.
- For the New Zealand Dollar (kiwi), read the NZD forecast.
- For USD/CAD (loonie), check out the Canadian dollar forecast
- For the Swiss Franc, see the USD/CHF forecast
