The New Zealand dollar dipped to lower ground before recovering nicely. The focus of the upcoming week is clearly the employment data. Can this give a boost to the kiwi?. Here is an analysis of fundamentals and an updated technical analysis for NZD/USD.
New Zealand enjoyed another nice trade surplus in March, with growth in both exports and imports. However, the ANZ business confidence continued to slide for a second month, albeit from extreme highs. The situation in New Zealand remains positive, but it is unclear if the kiwi already had its run. The US posted an excellent jobs report with a gain of 288K and a drop of the unemployment rate. Can this keep NZD/USD down?
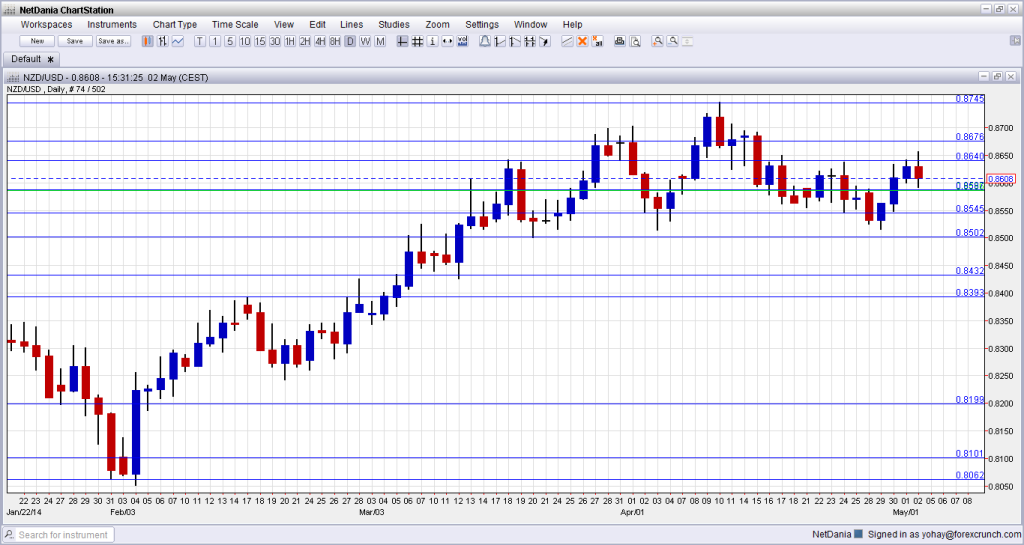
[do action=”autoupdate” tag=”NZDUSDUpdate”/]NZD/USD daily chart with support and resistance lines on it. Click to enlarge:
- Employment data: Tuesday, 22:45. Employment figures for Q4 2013 were no less than outstanding. Employment rose by a strong 1.1%. The unemployment rate dropped to 6% despite a rise in the participation rate. This time, a smaller growth in jobs is expected and the unemployment rate could tick higher on continued growth in the participation rate. The labor cost index which rose 0.6% q/q and 1.7% y/y is likely to proceed at the current velocity. An employment change figure of 0.7% is expected and the unemployment rate is predicted to drop to 5.8%.
- REINZ House Price Index: Thursday, 21:00. In March, house prices rose by 3.4%, the strongest in recent years. Prices in Auckland are on the move. A much more moderate rise is likely this time for the month of April.
- Credit Card retail sales: Thursday, 21:45. As official retail sales figures are published only once per quarter, this measure of consumption is certainly indicative. No change was recorded in March over February, but the year over year growth remained impressive: 5.1%. A similar y/y jump is expected now.
* All times are GMT.
NZD/USD Technical Analysis
Kiwi/dollar started of the week with a dip to lower ground, testing the 0.85 line (mentioned last week). It then recovered but was unable to hold onto 0.8640.
Technical lines, from top to bottom:
The multi year high of 0.8832 is not that far away. Below this level, we can mark the round number of 0.88 as minor resistance.
The new 2014 peak of 0.8745 joins the chart and will be watched on any upside move.
The 2013 peak of 0.8676 now switches to a pivotal line in the range. The previous 2014 peak of 0.8640 is close by and is still of significance.
It is followed by the stubborn May 2013 high of 0.8586 is another important line. The new April 2014 low of 0.8550 is the next stepping stone on the way down and now serves as important support.
0.85 is around number and could trigger comments by policymakers. A move above this line didn’t hold in early March 2014. 0.8435 was the peak in September and was retested in January. It is a strong double top.
0.8392 served as resistance was a recurring peak between November and February. 0.8335 capped a move higher in December and also had a role in the past. The pair fell short of this line in January 2014.
Below, 0.8280 supported the pair in February 2014 and also in the past. 0.82, worked as support several times: in September, October and also in December. It is somewhat weaker now.
I am bearish on NZD/USD
The economy in New Zealand is doing great, but this probably already priced in, After an amazingly strong employment report for Q4 2013, the upcoming employment report can only disappoint. Also the RBNZ would like a weaker kiwi. On the other side of the Pacific, the echoes from the strong NFP will probably keep the dollar bid.
More: Waiting to grab a long entry on GBPNZD
Further reading:
- For a broad view of all the week’s major events worldwide, read the USD outlook.
- For EUR/USD, check out the Euro to Dollar forecast.
- For the Japanese yen, read the USD/JPY forecast.
- For GBP/USD (cable), look into the British Pound forecast.
- For the Australian dollar (Aussie), check out the AUD to USD forecast.
- For USD/CAD (loonie), check out the Canadian dollar forecast.
