USD/JPY improved for a second straight week, as USD/JPY closed at the 119 line. This week’s highlights are the Tankan indices. Here is an outlook on the major events moving the yen and an updated technical analysis for USD/JPY.
In Japan, inflation remains at low levels, while Retail Sales missed expectations. In the US, key data painted a mixed picture. Inflation beat expectations and New Home Sales were also stronger than expected. However, durable goods orders were weak and GDP missed the estimate.
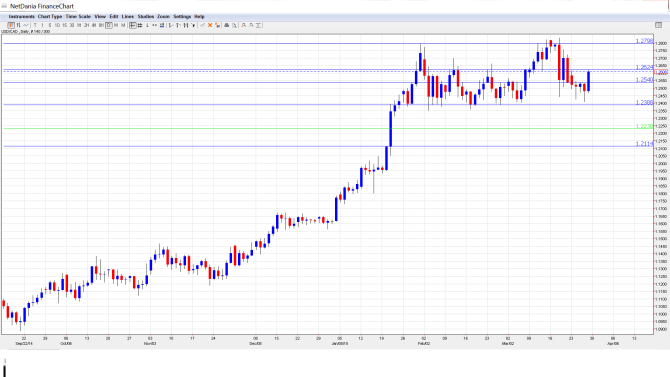
[do action=”autoupdate” tag=”USDJPYUpdate”/]USD/JPY graph with support and resistance lines on it:
- Preliminary Industrial Production: Sunday, 00:50. This indicator measures manufacturing production, a key component of economic growth. The indicator jumped 4.0% is January, well above the estimate of 2.9%. The markets are braced for a downturn in the February report, with an estimate of -1.8%.
- Average Cash Earnings: Tuesday, 2:30. This indicator provides an important gauge of consumer spending. The indicator softened to 1.3% in January, but this easily beat the estimate of 0.6%. The downward trend is expected to continue, with a February estimate of 0.7%.
- Housing Starts: Tuesday, 6:00. The housing industry continues to struggle, as underscored by the indicator, which continues to post declines. The January report came in at -13.0%, lower than the forecast of -11.1%. A more modest decline is expected in February, with an estimate of -7.0%.
- Tankan Manufacturing Index: Tuesday, 00:50. The Tankan indices are key events which often have a major impact on the direction of USD/JPY. The manufacturing index has been steady and came in at 12 points in Q4. A slight improvement is expected in the Q1 reading, with the estimate standing at 14 points.
- Tankan Non-Manufacturing Index: Tuesday, 00:50. The index improved in Q3 to 16 points, beating the estimate of 14 points. The markets are expecting better news in Q4, with an estimate of 17 points.
- Final Manufacturing PMI: Wednesday, 2:35. This PMI, a minor event, continues to post readings slightly above the 50-point level, which separates contraction from expansion. The February report came in at 51.6 points, almost matching the forecast. The index is expected to soften in the March reading, with an estimate of 50.4 points.
- Monetary Base: Wednesday, 00:50. Monetary Base measures the change in the total amount of domestic currency held by the BOJ. The indicator came in at 36.7% in February, ahead of the forecast of 34.3%. The estimate for the March report stands at 35.3%.
- 10-year Bond Auction: Thursday, 4:45. The yield on 10-year bonds was up slightly in March, coming in at 0.40%, marking a three-month high.
* All times are GMT
USD/JPY Technical Analysis
USD/JPY started the week at 120.02 and quickly touched a high of 120.16. The pair lost ground throughout the week, dropping to a low of 118.33, as support held firm at 117.94 (discussed last week). USD/JPY closed the week at 119.00.
Live chart of USD/JPY: [do action=”tradingviews” pair=”USDJPY” interval=”60″/]
Technical lines from top to bottom:
We start with resistance at 124.16. This line marked the start of a yen rally in June 2007, which saw USD/JPY drop to the 96 level.
122.19 is the next resistance line.
121.39 strengthened as USD/JPY continued to move to lower ground.
119.88 switched to a resistance level as the yen gained strength.
117.94 held firm in support as the pair dropped sharply during the week.
116.82 is providing strong support and has remained intact since mid-January.
115.85 is the next support line.
The final level for now is 114.19. It has held firm since November 2014.
I am neutral on USD/JPY
The Japanese yen has managed to hold its own and then some despite BOJ easing and the expectation of Fed rate hike later in the year. US data has been mixed, and much will depend on the key Tankan indices. If these indicators are unexpectedly strong, the yen rally could continue.
In our latest podcast we interview David Stein on investment, QE and lots more
Subscribe to Market Movers on iTunes
Further reading:
- For a broad view of all the week’s major events worldwide, read the USD outlook.
- For EUR/USD, check out the Euro to Dollar forecast.
- For the Japanese yen, read the USD/JPY forecast.
- For GBP/USD (cable), look into the British Pound forecast.
- For the Australian dollar (Aussie), check out the AUD to USD forecast.
- For the kiwi, see the NZDUSD forecast.
