The New Zealand dollar did dip to lower ground, but managed to stage a recovery, ending the week higher for a change. Has it bottomed out or are we just seeing the necessary correction? Milk prices lead to to CPI and these could provide the answer. Here is an analysis of fundamentals and an updated technical analysis for NZD/USD.
New Zealand business confidence dropped sharply from 23 to 5 points. Also the trouble in China weighed, and sent NZD/USD to a new low of 0.6620. However, the pair staged a recovery, partly in part to hopes for a Greek deal, and a turnaround in Chinese stocks, at least those of them that were trading.
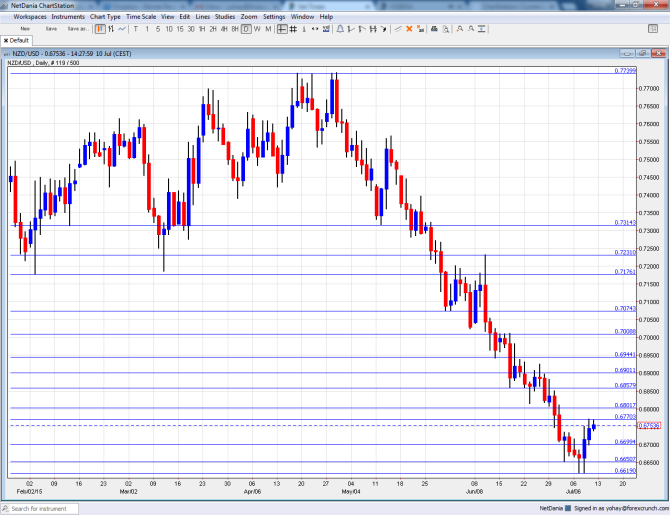
[do action=”autoupdate” tag=”NZDUSDUpdate”/]NZD/USD daily graph with support and resistance lines on it. Click to enlarge:
- FPI: Sunday, 22:45. The food price index is of importance due to New Zealand’s critical dairy exports. However, it is recently overshadowed by milk prices. After a rise of 0.4% in May, no major change is on the cards for June.
- GDT Price Index: Wednesday. The Global Dairy Index fell for 7 consecutive weeks, dropping 5.9% last time. Will it bounce now? This is expected, but never certain.
- Business NZ Manufacturing Index: Wednesday, 22:30. This PMI-like indicator stood on 51.5 points last time, reflecting modest growth. It could slip below the critical 50 point mark separating growth and contraction.
- CPI: Wednesday, 22:45. New Zealand published inflation data only once per quarter, making it even more important. This time, it precedes the RBNZ decision in July. A disappointing figure could trigger another rate cut. After a drop of 0.3% in Q1 2015, a bounce back worth 0.5% q/q is on the cards now.
NZD/USD Technical Analysis
Kiwi/dollar began the week with a slide, temporarily breaking below the 0.6650 level (mentioned last week). It then began a recovery, hitting a high of 0.6770.
Live chart of NZD/USD:
[do action=”tradingviews” pair=”NZDUSD” interval=”60″/]Technical lines, from top to bottom:
0.7315, which supported the pair in May and later capped a recovery attempt is strong resistance. One of the stops on the downside, 0.7235 was also a swing high in June.
It is followed by 0.7160 that served as resistance back in 2010 and was the low in January. Lower, the round level of 0.71 used to provide support in the past but was eventually breached.
0.7075 provided some support in May and is a weak level now. And of course, the very round level of 0.70 looms large and gave a fight before the pair continued south in June.
Further, the low of 0.6940 allowed for a temporary bounce. The round 0.69 level is switched positions to resistance.
0.6860 was a low point as the pair dropped in June 2015. It is followed by the 0.68 level that worked as resistance when the pair was climbing a few years back.
Close by, the July high of 0.6770 serves as resistance. It is followed by the round level of 0.67 that is a pivotal line in the range.
The new July low of 0.6650 was a multi-year low and the break below it was not confirmed. 0.6620 is the new 2015 low and for now serves as minor support.
The last line of support before the post crisis low of 0.6560.
I remain bearish on NZD/USD
The bounce back this week may only be a temporary correction. The kiwi could be hit by weak inflation, a resumption of the fall in Chinese stocks and weak inflation.
In our latest podcast we clarify Greece and also China, oil, AUD and more:
Further reading:
- For a broad view of all the week’s major events worldwide, read the USD outlook.
- For EUR/USD, check out the Euro to Dollar forecast.
- For the Japanese yen, read the USD/JPY forecast.
- For GBP/USD (cable), look into the British Pound forecast.
- For the Australian dollar (Aussie), check out the AUD to USD forecast.
- For USD/CAD (loonie), check out the Canadian dollar forecast.
