USD/JPY posted sharp gains last week, climbing almost 150 points. The pair closed the week at 108.65. There are seven events on the schedule this week. Here is an outlook on the major events moving the yen and an updated technical analysis for USD/JPY.
In the US, retail sales beat expectations and consumer confidence numbers surged higher. Japan’s current account surplus climbed higher, but this wasn’t enough to bolster the yen.
do action=”autoupdate” tag=”USDJPYUpdate”/]
USD/JPY graph with support and resistance lines on it. Click to enlarge: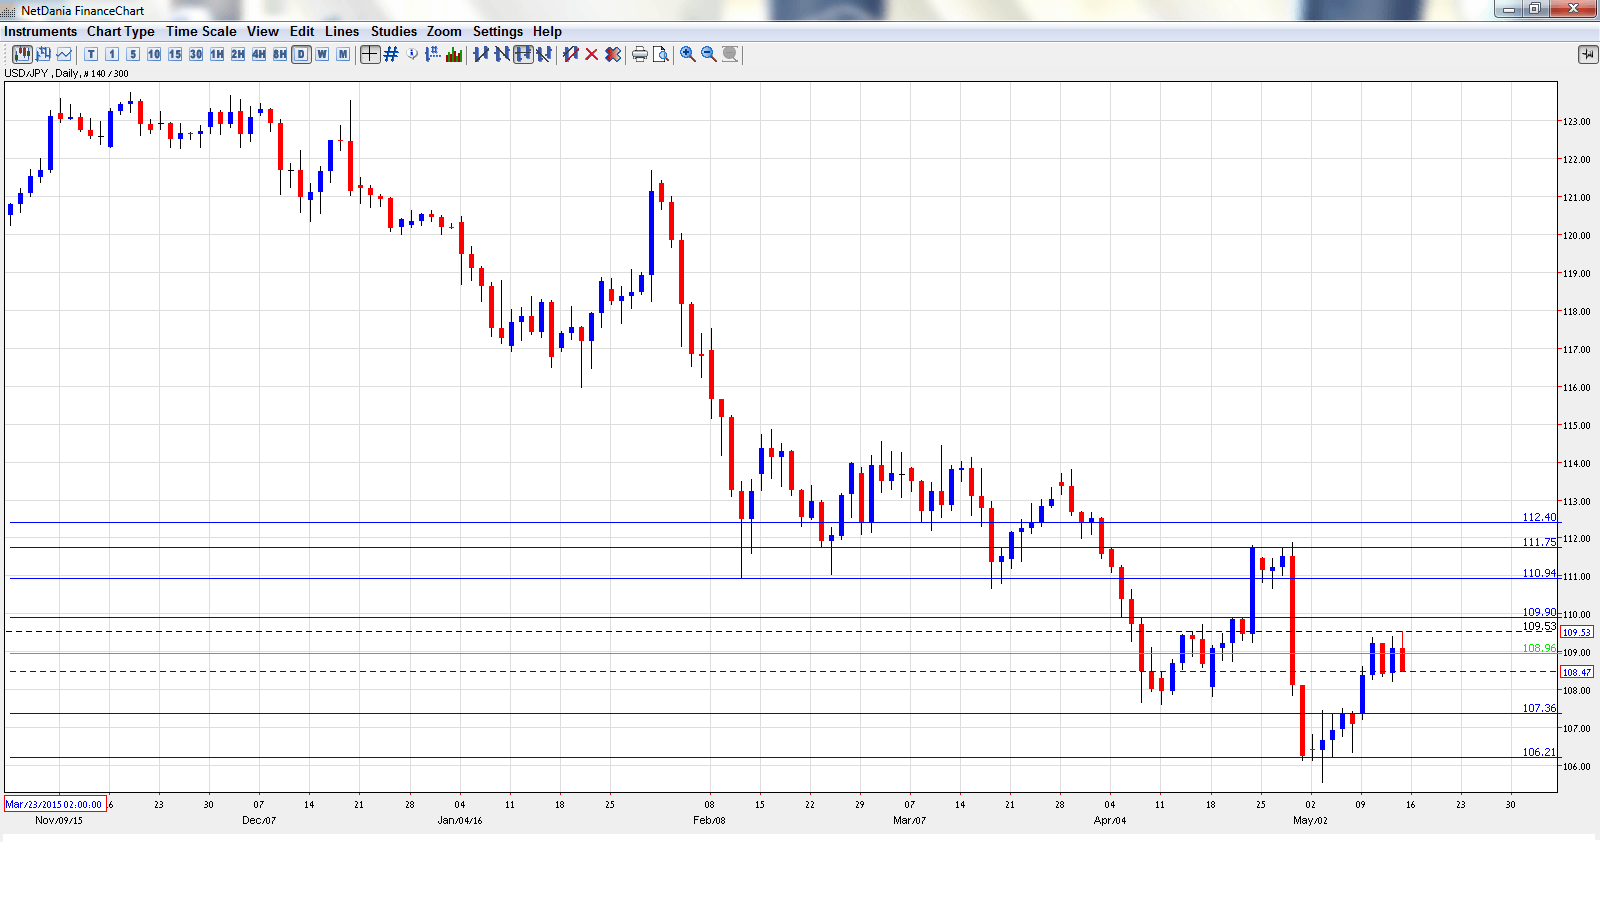
- PPI: Sunday, 23:50. PPI hasn’t posted a gain in over a year, and the index slipped to -3.8% in March, weaker than the estimate of -3.5%. Another weak reading is expected in April, with a forecast of -3.7%.
- Preliminary Machine Tool Orders: Monday, 6:00. The indicator is struggling, having posted 8 consecutive declines. The March reading was a weak -21.2%, and April is also likely to show a sharp decline.
- Revised Industrial Production: Tuesday, 4:30. The Japanese manufacturing sector has been hard-hit by the soft global economy. This indicator has posted three declines in the past four months. The February report slipped to -5.2%, but the markets are expecting a strong turnaround in March, with an estimate of 3.6%.
- Preliminary GDP: Tuesday, 23:50. GDP reports can have a sharp impact on the movement of USD/JPY. Final GDP declined 0.3% in Q4, within expectations. The markets are braced for a soft reading in Preliminary GDP for Q1, with an estimate of -0.4%.
- Preliminary GDP Price Index: Tuesday, 23:50. This indicator looks at the change in prices of all goods and services covered by GDP. Final GDP in Q4 posted a gain of 1.5%, matching the forecast. The Q1 estimate stands at 1.0%.
- Core Machinery Orders: Wednesday, 23:50. Core Machinery Orders tends to show sharp fluctuations between releases. The February reading posted a sharp decline of 9.2%, compared to a gain of 15% a month earlier. The estimate for the March reading stands at -1.9%.
- All Industries Activity: Thursday, 4:30. The indicator has looked weak, posting three declines in the past four months. In February, the indicator came in at -1.2%, within expectations. The markets are expecting a turnaround in March, with an estimate of +0.7%.
* All times are GMT
USD/JPY Technical Analysis
USD/JPY opened the week at 107.09 and quickly touched a low of 107.00. The pair then reversed directions and climbed to a high of 109.50, as 109.90 held firm in resistance (discussed last week). USD/JPY closed the week at 108.65.
Live chart of USD/JPY: [do action=”tradingviews” pair=”USDJPY” interval=”60″/]
Technical lines from top to bottom:
We start with resistance at 112.41. This line was a cushion in the first half of 2014.
111.74 is next.
110.94 was an important support level in February.
109.90 was a cap for much of April.
108.95 was a cushion in May 2006. It is a weak resistance line.
107.39 is providing support.
106.25 marked the start of a dollar rally in October 2014 which saw USD/JPY move above the 121 line.
105.44 is next.
The round number of 104 was a key line in May 2008. It is the final line for now.
I am bullish on USD/JPY
Speculation has increased that the BoJ may implement further easing in June or July, which would weaken the yen. With a June rate hike in the US on the table, monetary divergence will continue to weigh on the Japanese currency.
In our latest podcast we examine the upbeat US consumer and oil prices
Follow us on Sticher or on iTunes
Further reading:
- For a broad view of all the week’s major events worldwide, read the USD outlook.
- For EUR/USD, check out the Euro to Dollar forecast.
- For the Japanese yen, read the USD/JPY forecast.
- For GBP/USD (cable), look into the British Pound forecast.
- For the Canadian dollar (loonie), check out the Canadian dollar forecast.
- For the kiwi, see the NZD/USD forecast
