USD/JPY posted strong gains of 120 points, as the pair closed at 102.79. There are eight events this week. Here is an outlook for the highlights of this week and an updated technical analysis for USD/JPY.
In the US, NFP fell short of expectations, but this did not hurt the greenback’s momentum, especially as other wage growth and jobless numbers were more positive. In Japan, there were no surprises from the key Tankan indices, both of which met expectations.
do action=”autoupdate” tag=”USDJPYUpdate”/]
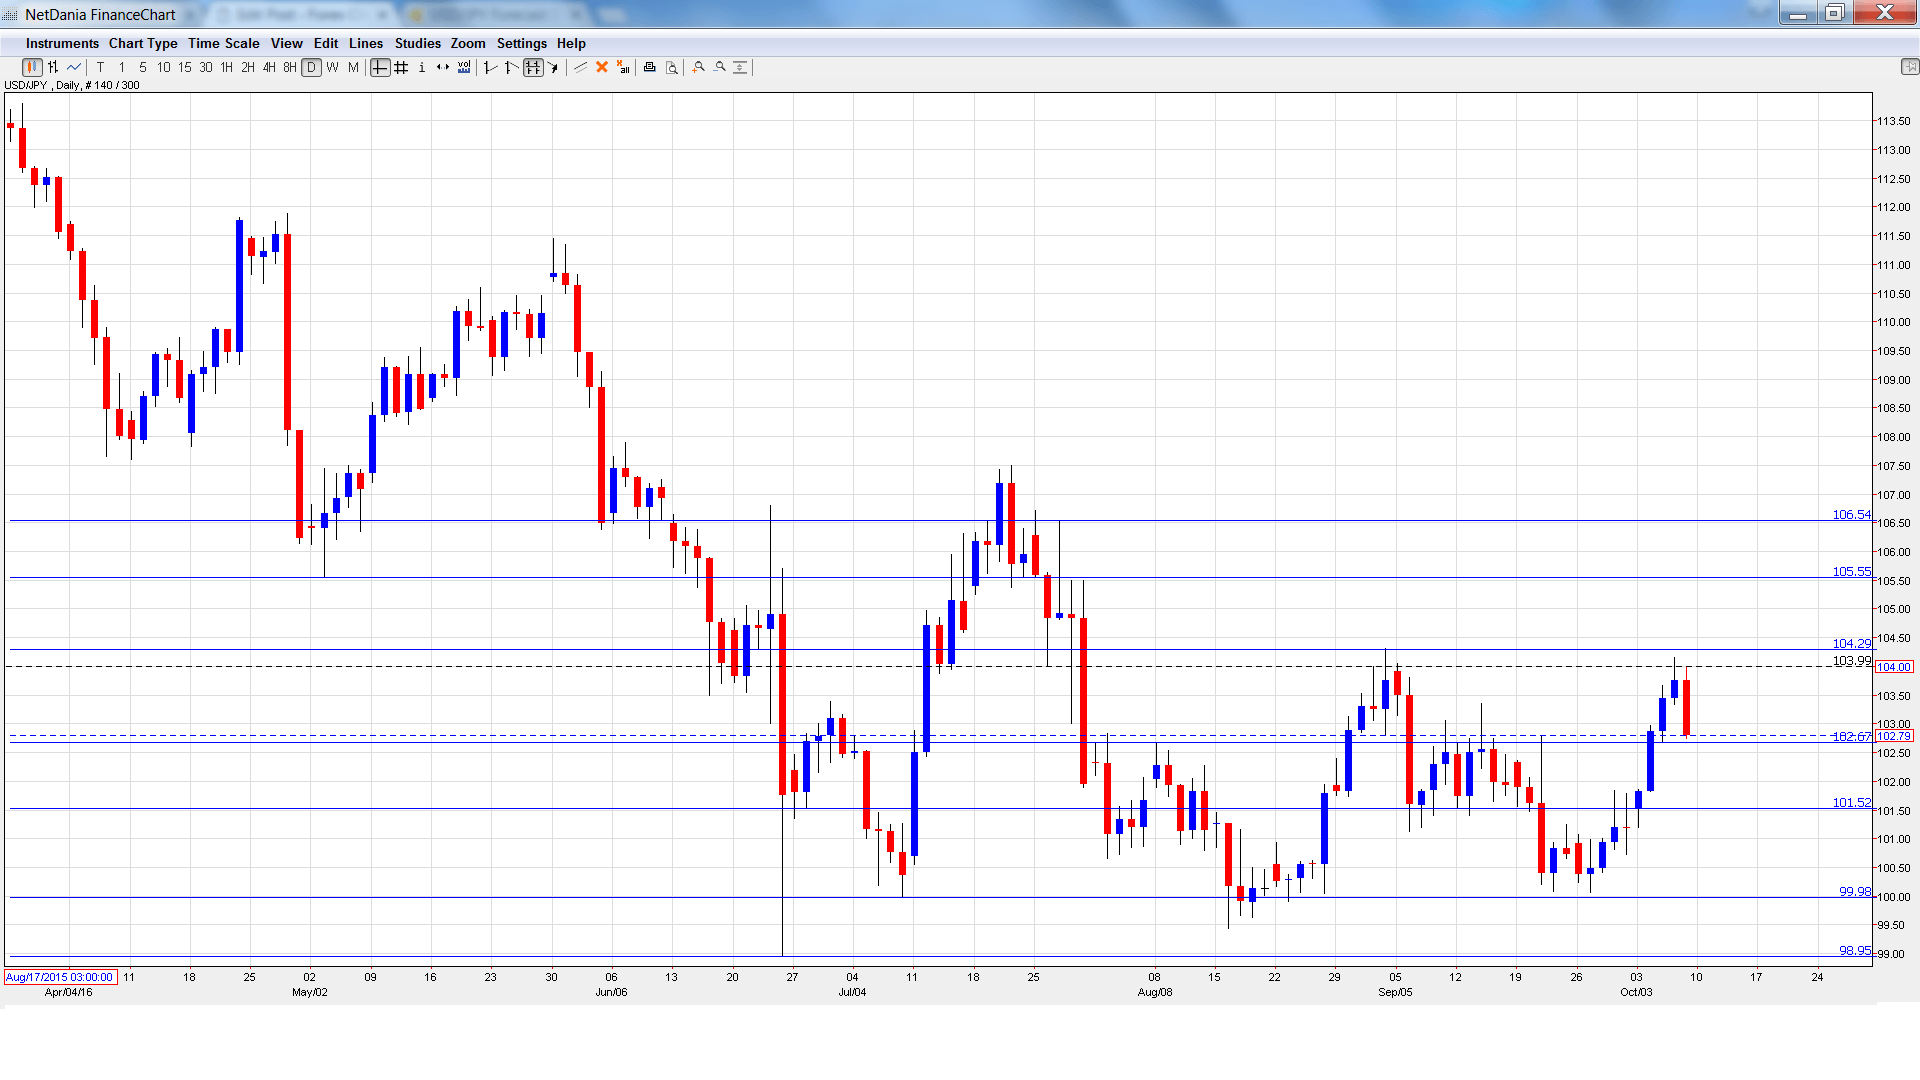
USD/JPY graph with support and resistance lines on it. Click to enlarge:
- Current Account: Monday, 23:50. Current Account is closely linked to currency demand. In July, the indicator slipped to 1.45 trillion yen, well short of the estimate of 1.59 trillion yen. The markets are expecting a strong turnaround in August, with an estimate of 1.58 trillion yen.
- Economy Watchers Sentiment: Tuesday, 5:00. The indicator continues to point to pessimism, with readings under the 50-point level. Little change is expected in the September report, with an estimate of 45.9 points.
- Core Machinery Orders: Tuesday, 23:50. This manufacturing indicator posted a second consecutive gain in July, with a gain of 4.9%. This figure crushed the forecast of -2.8%. The markets are braced for a sharp downturn in August, with an estimate of -4.4%.
- 30-year Bond Auction: Wednesday, 3:45. 30-year bonds continue to move upwards and posted a yield of 0.50% at the September auction. Will the upward trend continue?
- Preliminary Machine Tool Orders: Wednesday, 6:00. The indicator remains in negative territory, but the declines have tapered. In August, the indicator posted a decline of 8.4%, compared to a decline of 19.6% in the previous reading.
- Bank Lending: Wednesday, 23:50. Borrowing and spending levels are closely related, so analysts are interested in bank lending numbers. The indicator has been steady, posting a gain of 2.0% in the August release. An identical reading of 2.0% is expected in the September reading.
- Tertiary Industry Activity: Thursday, 4:30. The indicator dipped to 0.3% in July, within expectations. The markets are expecting a downturn in August, with an estimate of -0.2%.
- PPI: Thursday, 23:50. This inflation indicator continues to post declines, as the economy continues to struggle with low inflation. The index came in at -3.5% in August, within expectations. The estimate for the September release stands at -3.2%.
* All times are GMT
USD/JPY Technical Analysis
USD/JPY opened the week at 101.53. The pair dropped to a low of 101.20 early in the week. USD/JPY then reversed directions and climbed to a high of 104.16, as resistance held firm at 104.25 (discussed last week). The pair ended the week with sharp losses and closed the week at 102.79.
Live chart of USD/JPY:
Technical lines from top to bottom:
We start with resistance at 106.55.
105.55 was a cushion in May and June.
104.25 was tested in resistance as the pair posted sharp gains before retracting.
102.67 is a weak support line.
101.52 is next.
99.98 has held in support since late August.
98.95 has provided support since the Brexit vote in late June.
97.61 has provided support since November 2013. It is the final support line for now.
I am bullish on USD/JPY
The BoJ appears unwilling to implement further monetary easing, but the yen has nevertheless moved downwards. US numbers have generally been positive, so a December rate hike remains on the table, which is bullish for the greenback.
Our latest podcast is titled Bold BOJ vs. Fearful Fed
Follow us on Sticher or iTunes
Further reading:
- For a broad view of all the week’s major events worldwide, read the USD outlook.
- For EUR/USD, check out the Euro to Dollar forecast.
- For the Japanese yen, read the USD/JPY forecast.
- For GBP/USD (cable), look into the British Pound forecast.
- For the Canadian dollar (loonie), check out the Canadian dollar forecast.
- For the kiwi, see the NZD/USD forecast.
