AUD/USD has managed to separate itself from the 0.70 magnet and to rise to the upside.
The team at Morgan Stanley see more potential for rises:
Here is their view, courtesy of eFXnews:
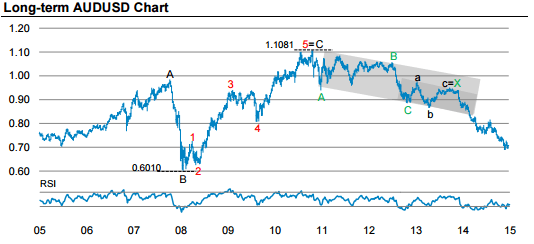
On the long-term AUD/USD Chart:
“When AUDUSD broke out of the bottom end of the longterm channel at 0.84, a further bearish AUD signal was triggered. We still target 0.65 for the end of next year but the short-term charts below show that there could be some upside in the coming weeks. Our positioning tracker suggests that the market remains short AUD, therefore opening room for a reversal,” MS argues.
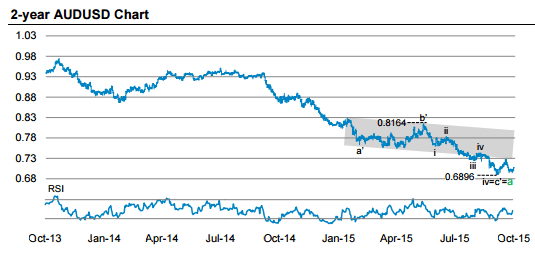
On the 2-year AUD/USD Chart:
“AUDUSD has failed to break below the 0.6896 low from early September. We believe that this was a sign that AUDUSD is set to rebound for the time being. We believe that AUDUSD has formed a complete a-wave structure, so the b-wave would take AUDUSD back into the trend channel drawn here. Initial moves above the 0.7300 high are required to keep the momentum,” MS adds.
On the 90-day AUD/USD Chart:
“AUDUSD attempted to make a new low but failed to go below 0.6937. We believe this was the end of a b’ wave, suggesting further upside for AUD, completing the c’ above 0.7273 at least. A move above here opens the way to our tactical trading target of 0.7500. The level is around the middle of the channel shown above,” MS projects.
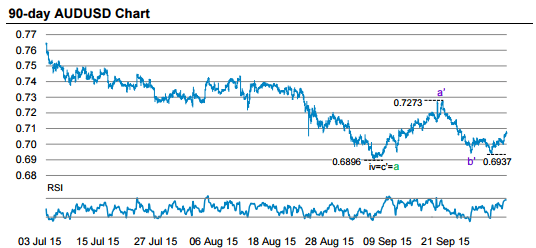
As a short-term trade, MS runs a limit order to buy AUD/USD at 0.7020 targeting a move to 0.75.
For lots more FX trades from major banks, sign up to eFXplus
By signing up to eFXplus via the link above, you are directly supporting Forex Crunch.
