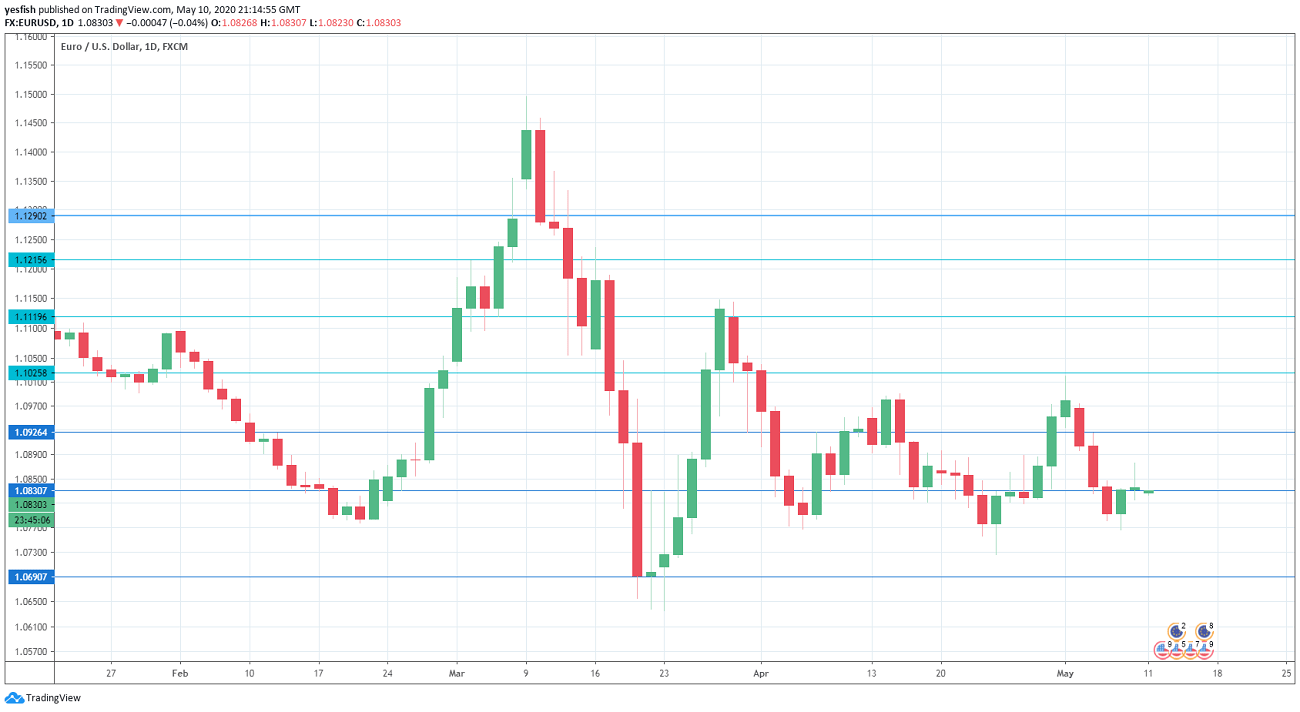
EUR/USD daily chart with support and resistance lines on it. Click to enlarge:
EUR/USD continues to display considerable volatility. The pair declined by 1.2 percent last week, erasing most of the gains seen a week earlier. The upcoming week features manufacturing and services PMIs. Here is an outlook at the highlights and an updated technical analysis for EUR/USD.
The eurozone economy is sputtering. Manufacturing PMIs in Germany and the eurozone were in the low-30s. The Services PMIs were brutal – Germany fell to 16.2, while the eurozone dropped to 12.0, pointing to a sharp contraction in the services sector in April. The pain was felt across the economy, as eurozone retail sales slumped by 11.2%, while German industrial production fell by 9.2 percent.
In the U.S., factory orders fell by 10.3% in March, after a flat 0.0% reading a month earlier. Employment numbers for April were dismal. Unemployment claims came in at 3.16 million, down from 3.8 million a week earlier. This brings the running total to a staggering 33.4 million. Nonfarm payrolls dropped by a record 20.5 million in April, slightly below the estimate of 22.4 million. The unemployment rate jumped to 14.7%, up from 4.4% a month earlier. Still, this beat the forecast of 16.0 percent. There was some good news, as wage growth shot up 4.7%, crushing the estimate of 0.5 percent.
- Eurozone Industrial Production: Wednesday, 5:00. After a sharp gain of 2.3% in February, the indicator sagged and posted a decline of -0.1%. Analysts are braced for a huge drop of 12 percent.
- German CPI: Thursday, 2:00. The initial read for consumer inflation posted a gain of 0.3% in April, above the forecast of 0.0 percent. The final read is expected to confirm the initial release.
- German Preliminary GDP: Friday, 2:00. In the fourth quarter of 2019, the German economy was stagnant, with a reading of 0.0 percent. The initial read for Q1 stands at -2.3%, as Europe’s powerhouse is expected to show a sharp downturn.
- Eurozone Flash GDP: Friday, 5:00. The eurozone economy recorded a weak gain of 0.1% in Q4 of 2019. Investors are braced for a dismal reading in Q1, with a forecast of -3.8 percent.
EUR/USD Technical analysis
Technical lines from top to bottom:
We start with resistance at 1.1215, which has held since mid-January. 1.1119 is next.
1.1025 (mentioned last week) has some breathing room after sharp losses by EUR/USD last week.
1.0900 remains relevant and has switched to a resistance role.
1.0829 was tested last week. It could see further action early next week.
The round number of 1.07 saw action in mid-March, when EUR/USD showed strong volatility.
1.0620 is protecting the 1.06 level.
1.05 is the final support level for now. is the final support line for now.
.
I remain bearish on EUR/USD
German and eurozone GDP numbers are projected to be brutal, reflecting deteriorating conditions across the eurozone due to the Covid-19 outbreak. This could weigh on the wobbly euro.
Further reading:
-
- GBP/USD forecast – Pound/dollar predictions
- USD/JPY forecast – analysis for dollar/yen
- AUD/USD forecast – the outlook for the Aussie dollar.
- USD/CAD forecast – Canadian dollar predictions
- Forex weekly forecast – Outlook for the major events of the week
Safe Trading!
