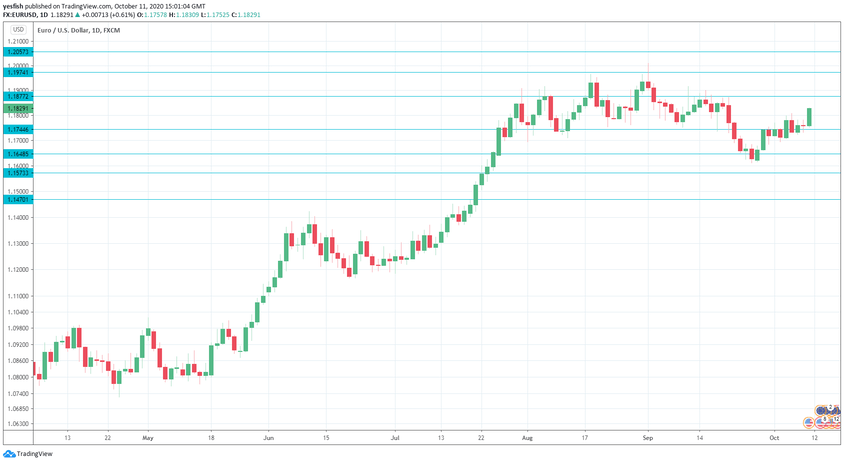
EUR/USD daily chart with support and resistance lines on it. Click to enlarge:
Services PMIs remained in contraction territory in Spain, France and Italy, with readings below the 50-level. Germany’s PMI was revised upwards to 50.6 from 49.1, which shows stagnation. The eurozone reading was also revised upwards, from 47.6 to 48.0 points. Eurozone retail sales were unexpectedly strong, with a gain of 4.4%. The estimate stood at 2.4%. In Germany, Factory Orders posted a gain of 4.5%, but Industrial Production came in at -0.2%. In the ECB minutes, policymakers expressed concerned over falling inflation as well as the high value of the euro, saying that the strong euro could hamper inflation and growth.
- German Final CPI: Tuesday, 6:00. Inflation has been declining in the eurozone’s largest economy. The August reading came in at -0.1% and another decline is projected for September, with an estimate of -0.2%.
- German ZEW Economic Sentiment: Tuesday, 9:00. Confidence in the German economy improved to 77.4 in September, but is expected to drop to 74.1 in October.
- Industrial Production: Wednesday, 9:00. Industrial production slowed to 4.1 in September, down from 9.1% beforehand. The October reading is expected to come in at just 0.8%.
- Eurozone Inflation Report: Friday, 9:00. Deflation remains a major concern for ECB policymakers. Inflation declined by 0.2% in August and the markets are braced for a -0.3% reading in September.
EUR/USD Technical analysis
Technical lines from top to bottom:
We start with resistance at 1.2136, an important monthly line.
1.2057 has held in resistance since April 2018.
1.1974 is protecting the symbolic 1.20 level.
1.1877 is next.
1.1744 has switched to support after strong gains by EUR/USD last week.
1.1648 is next.
1.1573 (mentioned last week) has provided support since July.
1.1470 is the final support level for now.
.
I am neutral on EUR/USD
The euro has looked sharp, but it more a case of dollar weakness than euro strength, as the euro economy continues to struggle. If Germany and the eurozone register weak inflation numbers, the US could recover some ground.
Further reading:
- EUR/USD forecast – for everything related to the euro.
- USD/JPY forecast – projections for dollar/yen
- AUD/USD forecast – predictions for the Aussie dollar.
- USD/CAD forecast – Canadian dollar analysis
- Forex weekly forecast – Outlook for the major events of the week.
Safe trading!
