- The EUR/USD pair dropped below the uptrend line, but only a new lower low could activate a strong sell-off.
- The price action signaled that the buyers were exhausted.
- A new higher high activates an upside continuation.
The EUR/USD price is trading at 1.0741 at the time of writing. The bias remains bullish as the pair stands above strong downside obstacles. The price turned to the downside in the short term as the Dollar index has managed to rebound. Still, don’t forget that the DXY remains under bearish pressure. A new swing higher is far from being confirmed.
-Are you interested in learning about forex indicators? Click here for details-
Technically, the currency pair may test the immediate downside obstacles before coming back higher again. Fundamentally, the US is to release high-impact data during the week, so the fundamental factors could drive the rate.
As you already know, the Dollar Index was in a corrective phase. Still, the retreat could be over soon if the US data came in better than expected because the FED is expected to continue hiking rates in the next monetary policy meetings.
Today, the CB Consumer Confidence is expected at 103.9, below 107.3 in the previous reporting period. Chicago PMI may drop from 56.4 to 55.0 points, while the HPI could report a 2.05 growth. The German Unemployment Change came in at -4K versus -16K estimates earlier. Also, the French Prelim GDP, French Prelim CPI, and the French Consumer Spending came in worse than expected. The Euro-zone CPI Flash Estimate and the Core CPI Flash Estimate could also bring some action.
EUR/USD price technical analysis: Bearish divergence
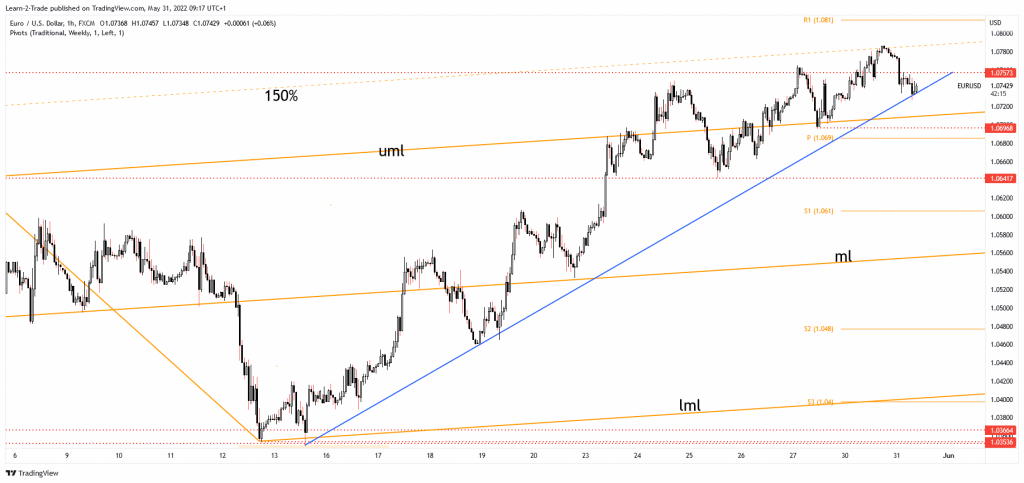
As you can see on the 1-hour chart, the pair found resistance at the 150% Fibonacci line of the ascending pitchfork. Now, it challenges the uptrend line after retesting the 1.0757 key resistance. Failing to stay above this static resistance may signal exhausted buyers and a potential sell-off.
-Are you interested in learning about the forex signals telegram group? Click here for details-
Technically, the ascending pitchfork’s upper median line (UML) is dynamic support. The 1.0696 former low represents a static downside obstacle. The price action and the RSI showed a bearish divergence, but only a new lower low could activate a downside movement.
It’s premature to talk about a larger drop only because it dropped below the uptrend. Coming back above 1.0757 and making a new higher high may activate further growth.
Looking to trade forex now? Invest at eToro!
68% of retail investor accounts lose money when trading CFDs with this provider. You should consider whether you can afford to take the high risk of losing your money
